


20021201
5-3-1
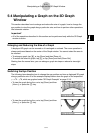
Drawing a 3D Graph
5-3 Drawing a 3D Graph
This section explains how to draw a 3D graph, as well as how to change the angle of a graph
and how to rotate a graph.
Configuring 3D Graph View Window Parameters
3D Graph View Window parameters let you specify the maximum and minimum values for
the x-, y- and z-axis. You can also specify the number of lines you would like for drawing the
grid.
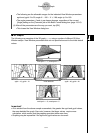
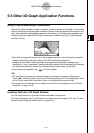
•For the xgrid enter the number of lines you would like drawn within the interval from xmin to
xmax. For example, if xmin = −3, xmax = 3 and xgrid= 15, 15 almost vertical lines will be
used to display your graph. The ygrid lines will be almost horizontal.
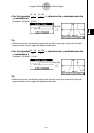
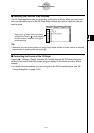
•After drawing a 3D graph, pressing the = key cycles the 3D Graph [Axes] setting (page
13-3-6) in the following sequence: “Off” → “On” → “Box” → “Off”, and so on.
Before drawing a graph, be sure to first configure View Window parameters as required to
ensure proper display of the graph.
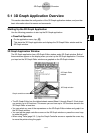
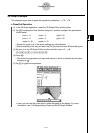
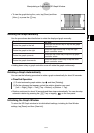
u ClassPad Operation
(1) On the application menu, tap D.
•This starts up the 3D Graph application and displays the initial screen of the active 3D
Graph Editor window.
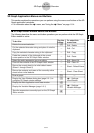
(2) Tap 7 to display the View Window dialog box.
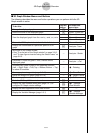
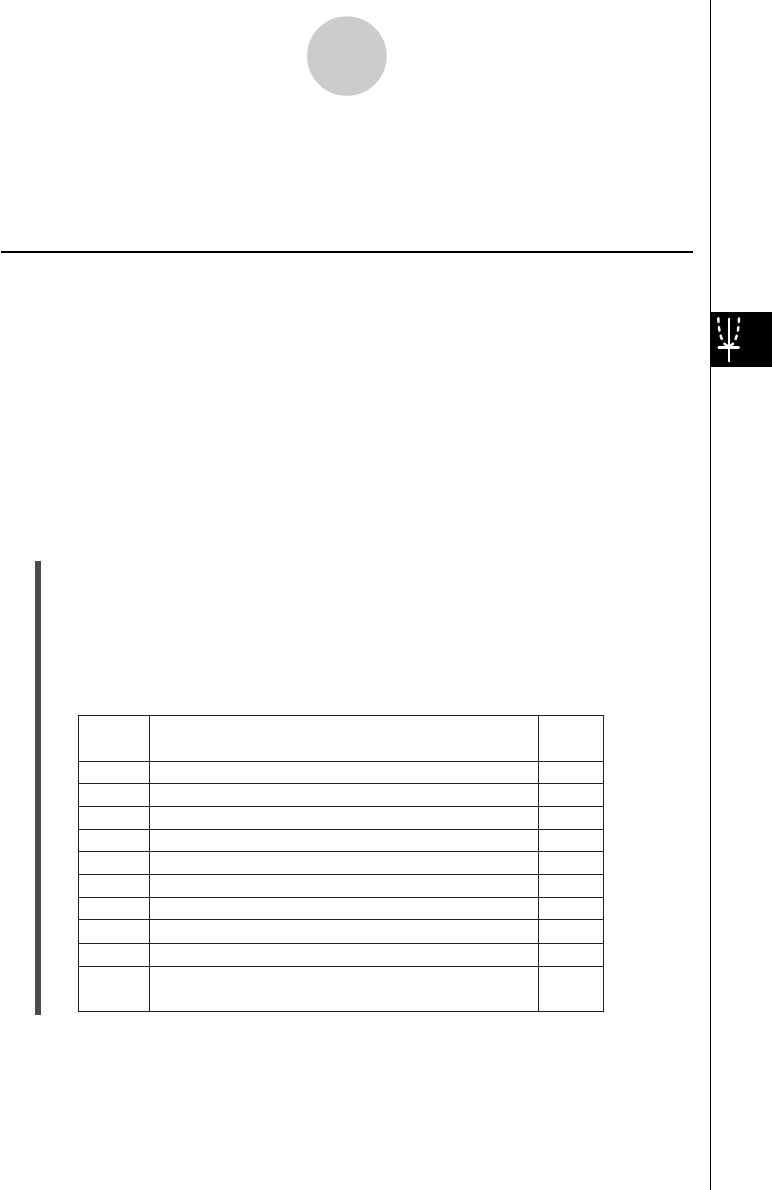
(3) Configure the View Window parameters as described below.
•Press c to move the cursor and input an appropriate value for each parameter.
Use this
item:
Initial
default
To configure this View Window parameter:
xmin
xmax
xgrid
ymin
ymax
ygrid
zmin
Minimum
x-axis value
Maximum
x-axis value
Number of grid lines used for x-axis direction
Minimum
y-axis value
Maximum y-axis value
Number of grid lines used for y-axis direction
Minimum z-axis value
zmax Maximum
z-axis value
angle Clockwise angle of x-axis
angle
Eye position relative to the plane created by
the
x-axis and y-axis, and the angle of the z-axis
φ
θ
–3
3
25
–3
3
25
–3
3
20
70
20030201