


20021201
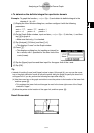
u To determine the definite integral for a particular domain
Example: To graph the function y = x(x + 2)(x – 2) and obtain its definite integral in the
domain of 1 < x < 2
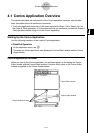
(1) Display the View Window dialog box, and then configure it with the following
parameters.
xmin = –7.7, xmax = 7.7, xscale = 1
ymin = –4, ymax = 4, yscale = 1
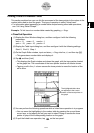
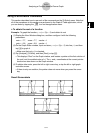
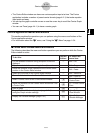
(2) On the Graph Editor window, input and store y = x(x + 2)(x – 2) into line y1, and then
tap $ to graph it.
•Make sure that only y1 is checked.
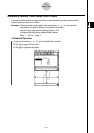
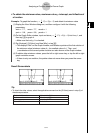
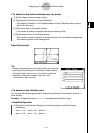
(3) Tap [Analysis], [G-Solve], and then [
∫
dx].
• This displays “Lower” on the Graph window.
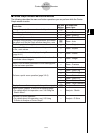
(4) Press 1.
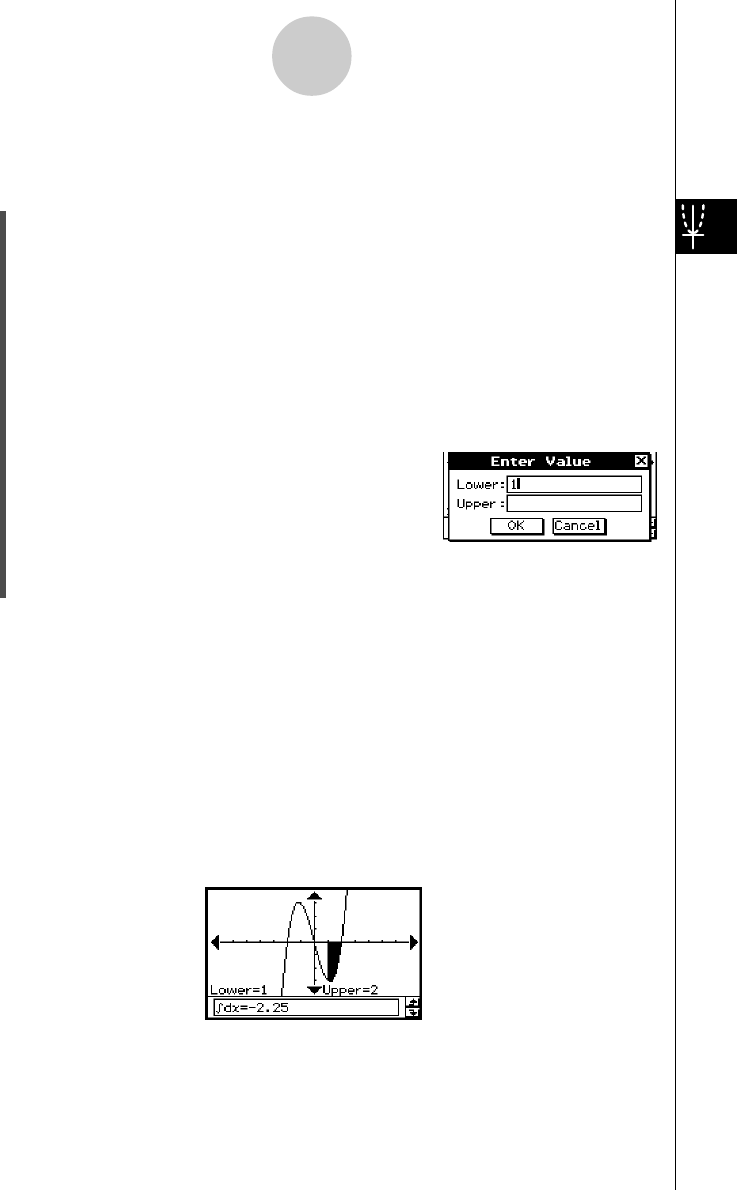
• This displays a dialog box for inputting an interval for
the x-values, with 1 specified for the lower limit of the
x-axis (Lower).
3-8-6
Analyzing a Function Used to Draw a Graph
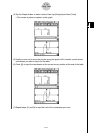
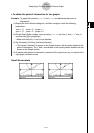
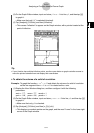
(5) Tap the [Upper] input box and then input 2 for the upper limit of the x-axis.
(6) Tap [OK].
Tip
• Instead of inputting [Lower] and [Upper] values in steps (4) through (6), you can use the cursor
key or the graph controller arrows to move the pointer along the graph to specify the lower limit
and upper limit. If you do, perform the following two steps after step (3).
(4) Use the cursor key or the graph controller to move the pointer to the location of the lower limit
and then press E.
• This registers the lower limit and changes the word in the lower right corner of the Graph
window to “Upper”.
(5) Move the pointer to the location of the upper limit, and then press E.
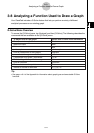
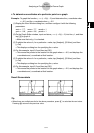
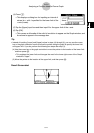
Result Screenshot