


20021201
4-4-1
Using Trace to Read Graph Coordinates
4-4 Using Trace to Read Graph Coordinates
Trace allows you move a pointer along a graph line and display the coordinates at the
current pointer location.
Starting the trace operation causes a crosshair pointer ( ) to appear on the graph. You can
then press the cursor key or tap the graph controller arrows to move the pointer to the
location you want, and read the coordinates that appear on the display.
Using Trace
Example: To graph the function x = 2(y – 1)
2
– 2 and then perform a trace operation to read
coordinates
u ClassPad Operation
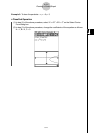
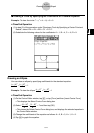
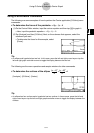
(1) On the Conics Editor window, input the above equation and then tap ^ to graph it.
(2) Tap [Analysis] and then [Trace], or tap =.
• This causes “Trace” to appear on the Graph window, with a pointer on the graph line.
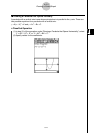
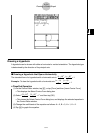
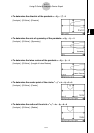
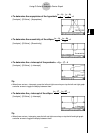
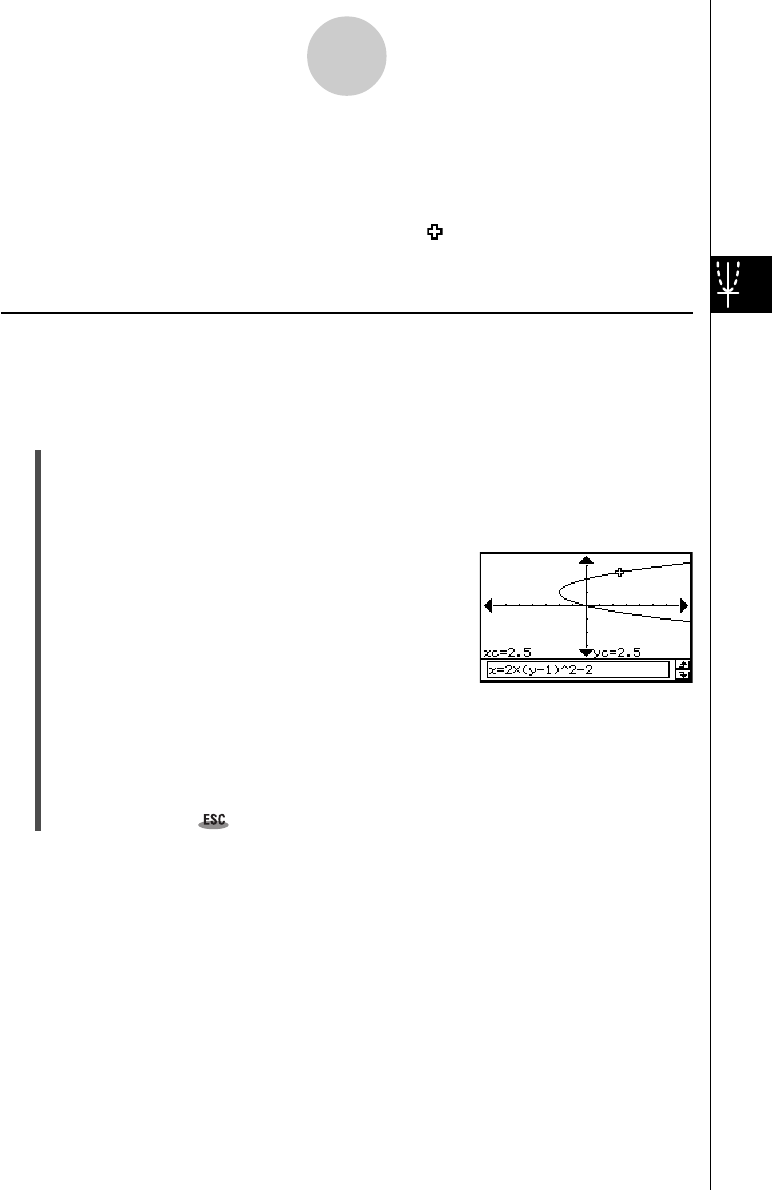
(3) Press the left or right cursor key, or tap the left or right graph controller arrows.
• This moves the pointer along the graph, and displays
the coordinates of the current pointer location.
•When the location of the pointer approaches the point
of infinity on a parabolic or hyperbolic graph, “Error”
appears in place of the pointer coordinates.
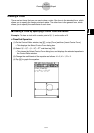
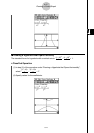
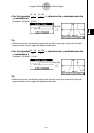
•You can also move the pointer to a particular point by inputting coordinates. Input
values into the message box and then tap [OK].
Here, input a value for yc in the case of a parabola that opens horizontally. Input a
value for xc in the case of a parabola that opens vertically. For any other type of
conics graph, input a value for tc in order to graph in parametric format.
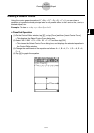
(4) To exit trace, tap on the icon panel.
Tip
• While tracing, tapping the displayed coordinate values causes the coordinate values to appear in
the message box. You can then copy the coordinates to the clipboard.