


20021201
Drawing a Exponential Regression Graph (
y = a·b
x
)
Exponential regression can be used when y is proportional to the exponential function of x.
The normal exponential regression formula in this case is y = a·b
x
. If we take the natural
logarithms of both sides, we get ln(y) = ln(a) + (ln(b)) · x. Next, if we say that Y = ln(y),
A = ln(a) and B = ln(b), the formula corresponds to the linear regression formula Y = A + B·x.
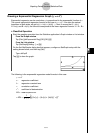
u ClassPad Operation
Start the graphing operation from the Statistics application’s Graph window or List window.
From the Graph window
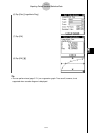
Tap [Calc] [abExponential Reg] [OK] [OK] ".
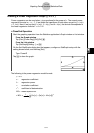
From the List window
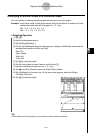
Tap [SetGraph][Setting...], or G.
On the Set StatGraphs dialog box that appears, configure a StatGraph setup with the
setting shown below, and then tap [Set].
Type: abExpR
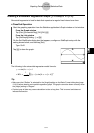
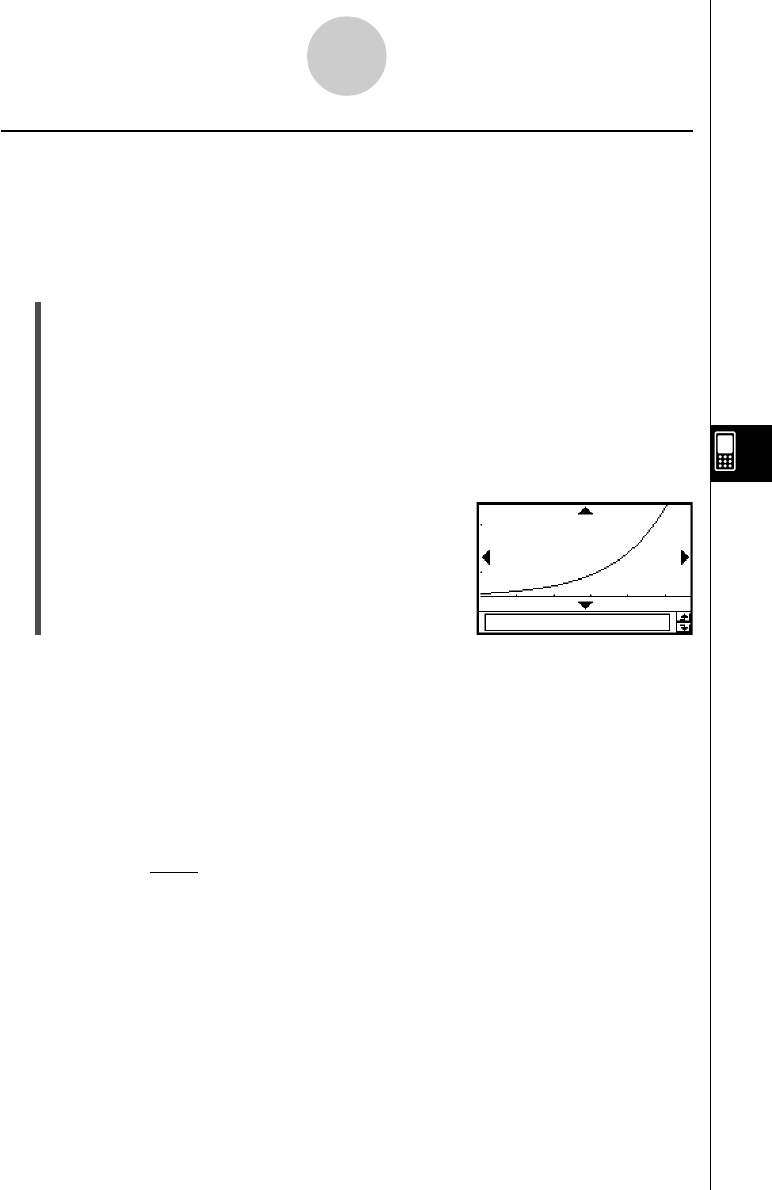
Tap y to draw the graph.
7-5-11
Graphing Paired-Variable Statistical Data
The following is the exponential regression model formula in this case.
y = a·b
x
a : regression coefficient
b : regression constant term
r : correlation coefficient
r
2
: coefficient of determination
MSe :mean square error
• MSe =
Σ
1
n – 2
i=1
n
(ln (yi) – (ln (a) + (ln (b))
.
xi))
2
20030401