


20021201
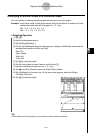
Viewing Paired-variable Statistical Calculation Results
Besides using a graph, you can also use the following procedure to view the paired-variable
statistics parameter values.
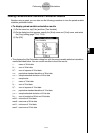
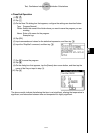
u To display paired-variable calculation results
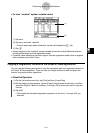
(1) On the menu bar, tap [Calc] and then [Two-Variable].
(2) On the dialog box that appears, specify the [XList] name and [YList] name, and select
the [Freq] setting (page 7-3-3, 7-3-4).
(3) Tap [OK].
7-7-2
Performing Statistical Calculations
•This displays the Stat Calculation dialog box with the paired-variable statistical calculation
results described below. You can use the scrollbar to scroll the results.
o :mean of XList data
Σx : sum of XList data
Σx
2
: sum of squares of XList data
xσn : population standard deviation of XList data
xσn–1 : sample standard deviation of XList data
n : sample size
p :mean of YList data
Σy : sum of YList data
Σy
2
: sum of squares of YList data
yσn : population standard deviation of YList data
yσn–1 : sample standard deviation of YList data
Σxy : sum of products of XList and YList data
minX : minimum of XList data
maxX : maximum of XList data
minY : minimum of YList data
maxY : maximum of YList data