


20021201
3-2-2
Using the Graph Window
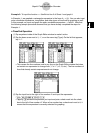
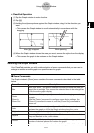
Polar Coordinates and Parametric Coordinates
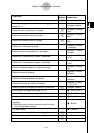
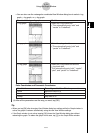
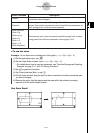
To select this type of graph:
x-log graph
y-log graph
xy-log graph
Do this:
Select the
x-log check box.
• This automatically sets “xdot” and
“xscale” to “Undefined”.
Select the
y-log check box.
• This automatically sets “ydot” and
“yscale” to “Undefined”.
Select the
x-log check box and the
y-log check box.
This automatically sets “xdot”, “xscale”,
“ydot”, and “yscale” to “Undefined”.
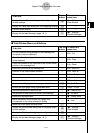
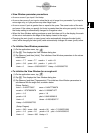
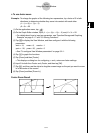
Use this item:
t min
t max
t step
To configure this View Window parameter:
Minimum value of
t
Maximum value of t
Step size of t
θ
θ
θ
θ
θ
θ
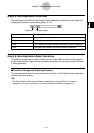
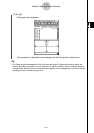
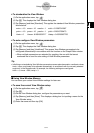
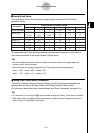
(4) After all the parameters are the way you want, tap [OK].
Tip
• When you tap [OK] after changing View Window dialog box settings while the Graph window is
active, the graph is redrawn automatically using the new View Window settings.
• If the Graph window is not active, tapping [OK] closes the View Window dialog box without
redrawing the graph. To redraw the graph in this case, tap $ on the Graph Editor window.
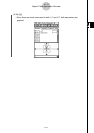
•You can also use the rectangular coordinate View Window dialog box to select x-log
graph, y-log graph, or xy-log graph.
20030201