


20021201
7-4-3
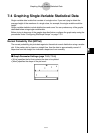
Graphing Single-Variable Statistical Data
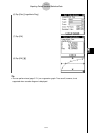
k Graph Parameter Settings (page 7-3-3, 7-3-4)
•[XList] specifies the list that contains the data to be plotted.
• [Freq] specifies the frequency of the data.
Tip
• When specifying a list of frequency values, make sure that the list contains positive integers only.
Non-integer values (such as those with a decimal part) cause an error during statistical
calculations.
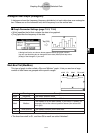
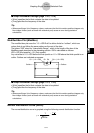
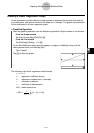
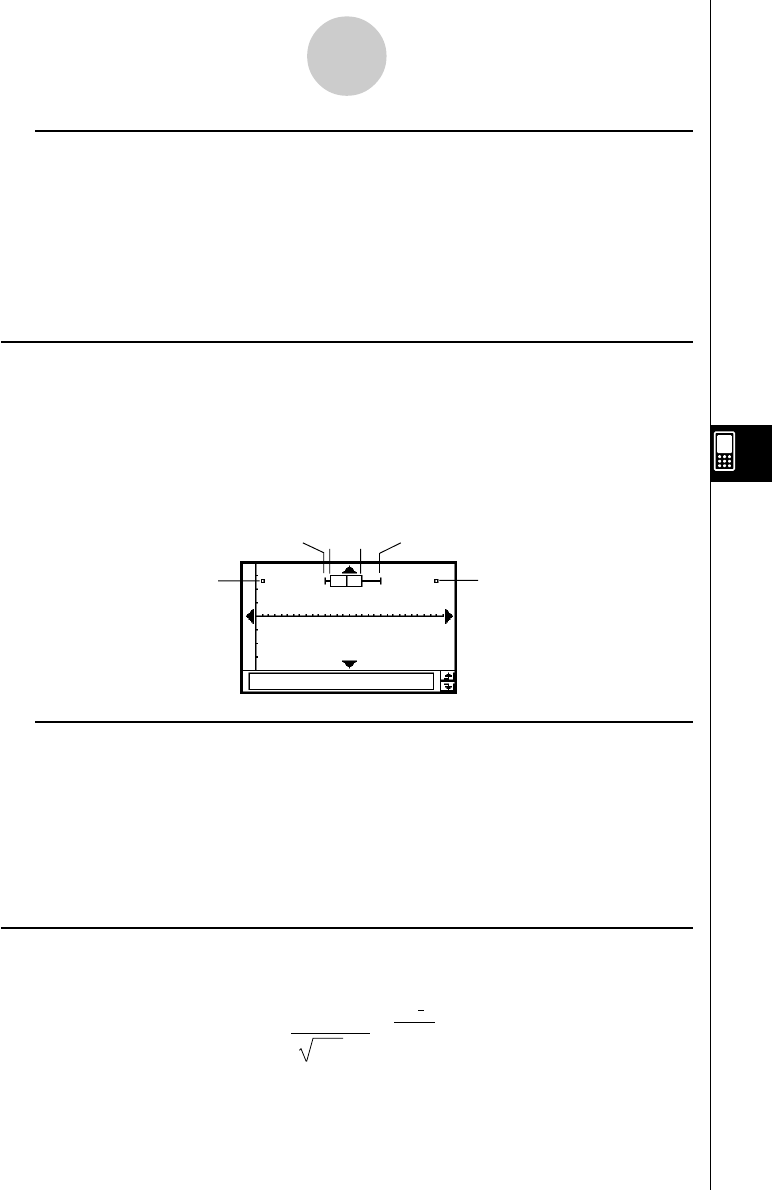
Modified-Box Plot (ModBox)
The modified box plot uses the “1.5 × IQR Rule” to define limits for “outliers”, which are
values that do not follow the same pattern as the rest of the data.
The letters “IQR” stand for “Interquartile Range”, which is the length of the box of the
MedBox graph described in the preceding section. IQR is calculated as follows:
IQR = Q3 (third quartile) – Q1 (first quartile).
Any value that is 1.5 × IQR below the first quartile or 1.5 × IQR above the third quartile is an
outlier. Outliers are indicated as squares.
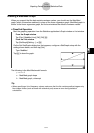
y
=
1
2 πσ
n
e
–
2σ
n
2
(
x–
x
)
2
k Graph Parameter Settings (page 7-3-3, 7-3-4)
•[XList] specifies the list that contains the data to be plotted.
• [Freq] specifies the frequency of the data.
Tip
• When specifying a list of frequency values, make sure that the list contains positive integers only.
Non-integer values (such as those with a decimal part) cause an error during statistical
calculations.
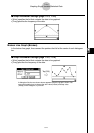
Normal Distribution Curve (NDist)
The normal distribution curve is graphed using the following normal distribution function.
Outliers
Q1 – (1.5 × IQR)
Q1
Q3
Q3 + (1.5 × IQR)
Outliers