


20021201
Drawing Quadratic, Cubic, and Quartic Regression Graphs
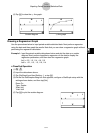
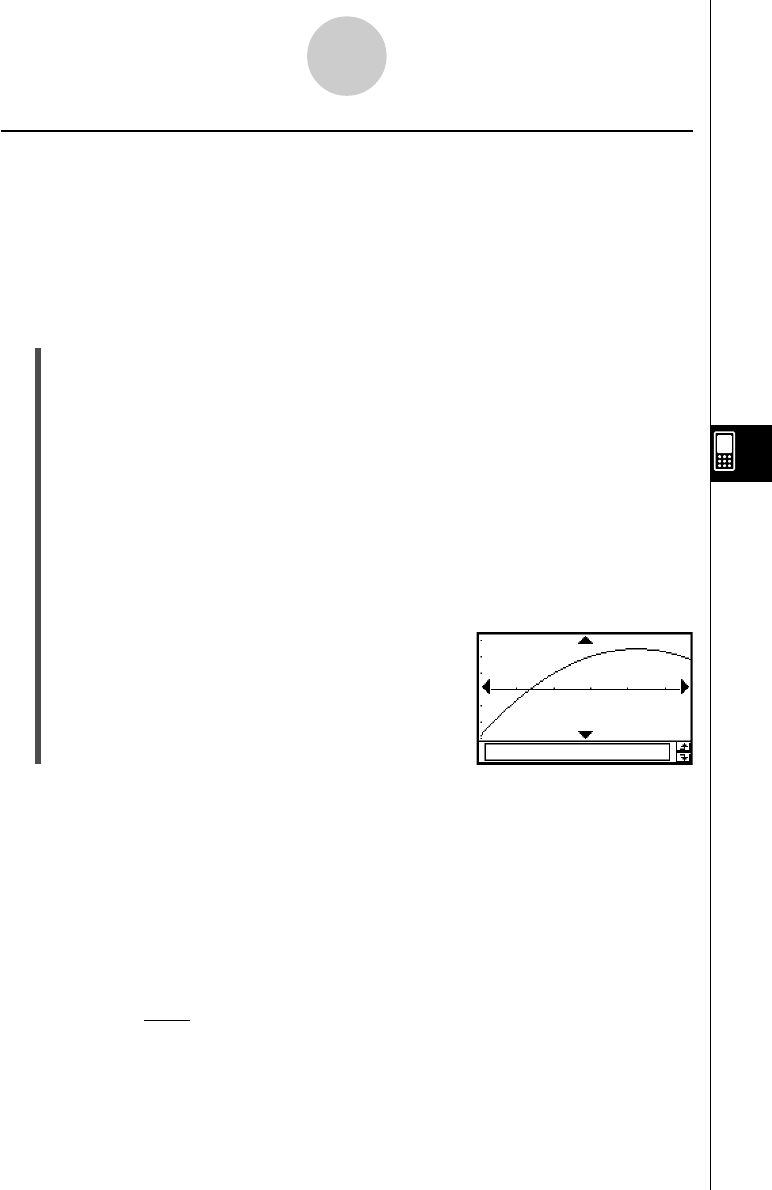
You can draw a quadratic, cubic, or quartic regression graph based on the plotted points.
These graphs use the method of least squares to draw a curve that passes the vicinity of as
many data points as possible. These graphs can be expressed as quadratic, cubic, and
quartic regression expressions.
The following procedure shows how to graph a quadratic regression only. Graphing the cubic
and quartic regressions are similar.
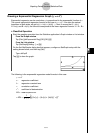
u ClassPad Operation (Quadratic Regression)
Start the graphing operation from the Statistics application’s Graph window or List window.
From the Graph window
Tap [Calc] [Quadratic Reg] [OK] [OK] ".
• For cubic regression tap [Cubic Reg] and for quartic regression tap [Quartic Reg]
instead of [Quadratic Reg].
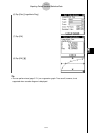
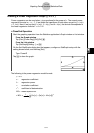
From the List window
Tap [SetGraph][Setting...], or G.
On the Set StatGraphs dialog box that appears, configure a StatGraph setup with the
setting shown below, and then tap [Set].
Type: QuadR
• For cubic regression select [CubicR] and for quartic regression tap [QuartR] instead
of [QuadR].
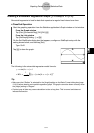
Tap y to draw the graph.
7-5-7
Graphing Paired-Variable Statistical Data
The following are the model formulas for each type of regression.
Quadratic Regression
Model Formula: y = a·x
2
+ b·x + c
a
: quadratic regression coefficient
b : linear regression coefficient
c : regression constant term (y-intercept)
r
2
: coefficient of determination
MSe :mean square error
• MSe =
Σ
1
n – 3
i=1
n
(y
i
– (a·x
i
+ b·x
i
+ c))
2
2