


20021201
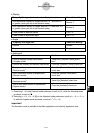
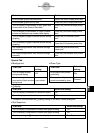
To do this: Do this:
Draw multiple graphs simultaneously Select the [Simul Graph] check box.
Draw multiple graphs one-by-one Clear the [Simul Graph] check box.*
Turn on display of coordinates of your graph and Select the [Derivative/Slope] check
its derivative in the Ordered Pair table box.
Turn off display of coordinates of Graph window Clear the [Derivative/Slope] check
pointer and derivative on number table display box.*
Turn on display of graph controller arrows during Select the [G-Controller] check
graphing box.*
Turn off display of graph controller arrows during
graphing
Clear the [G-Controller] check box.
Set Statistics application View Window settings Select the [Stat Window Auto]
automatically check box.*
Set Statistics application View Window settings Clear the [Stat Window Auto] check
manually box.
13-3-5
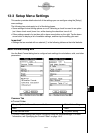
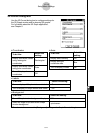
Setup Menu Settings
u Background
To do this:
Select this
setting:
Turn off Graph window
background display
Off*
Select an image to be
used as the Graph window <pict name>
background
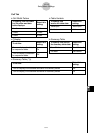
u Draw Type
To do this:
Select this
setting:
Draw graphs with plotted
points only
Plot
Draw graphs with plotted
points connected by lines
Connect*
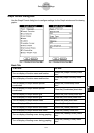
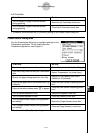
Special Tab
• The above is the same as the [∑display] setting on the Basic Format dialog box.
u Set Sequence
u ∑display
To do this: Select this setting:
Turn on display of subtotals for sequence tables On
Turn off display of subtotals for sequence tables Off*
To do this: Select this setting:
Turn on display of expressions created after graph drawing On*
Turn off display of expressions created after graph drawing Off
Require pressing of E for expression display StepDisp