


WS 2000 Wireless Switch System Reference Guide8-8
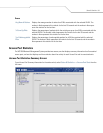
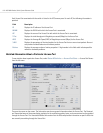
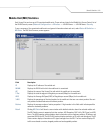
General WLAN Information
Information Section
Traffic Area
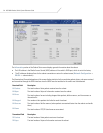
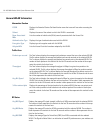
RF Status
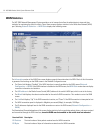
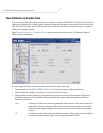
ESSID Displays the Extended Service Set Identification name that users will see when accessing the
WLAN.
Subnet Displays the name of the subnet to which this WLAN is associated.
Num. Associated
MUs
Lists the number of mobile units (MUs) currently associated with the Access Port.
Authentication Type Displays the type of authentication used with this WLAN.
Encryption Type Displays type of encryption used with this WLAN.
Adopted APs Lists the Access Ports that have been adopted by this WLAN.
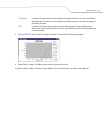
Packets per second The Total column displays the average total packets per second that cross the selected WLAN.
The Rx column displays the average total packets per second received on the selected WLAN.
The Tx column displays the average total packets per second sent on the selected WLAN. The
number in black represents this statistic for the last 30 seconds and the number in blue repre-
sents this statistic for the last hour.
Throughput The Total column displays the average throughput in Mbps for a given time period on the
selected WLAN. The Rx column displays the average throughput in Mbps for packets received
on the selected WLAN. The Tx column displays the average throughput for packets sent on the
WLAN WLAN. The number in black represents this statistic for the last 30 seconds and the num-
ber in blue represents this statistic for the last hour.
Avg. Bit Speed The Total column displays the average bit speed in Mbps for a given time period on the selected
WLAN.This includes all packets that are sent and received. The number in black represents this
statistic for the last 30 seconds and the number in blue represents this statistic for the last hour.
% Non-unicast pkts Displays the percentage of the total packets for the selected WLAN that are non-unicast pack-
ets. Non-unicast packets include broadcast and multicast packets.The number in black repre-
sents this statistic for the last 30 seconds and the number in blue represents this statistic for the
last hour.
Avg MU Signal Displays the average RF signal strength in dBm for all MUs associated with the selected WLAN.
The number in black represents this statistic for the last 30 seconds and the number in blue rep-
resents this statistic for the last hour.
Avg MU Noise Displays the average RF noise for all MUs associated with the selected WLAN. The number in
black represents this statistic for the last 30 seconds and the number in blue represents this sta-
tistic for the last hour.
Avg MU SNR Displays the average Signal to Noise Ratio (SNR) for all MUs associated with the selected
WLAN. The Signal to Noise Ratio is an indication of overall RF performance on your wireless net-
works.