


CDM-Qx Satellite Modem Revision 5
Front Panel Operation MN/CDMQx.IOM
5–57
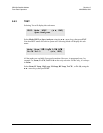
5.6.2.4 (MonitorStats) – LINK STATISTICS (for grouped as modem only)
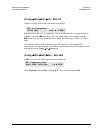
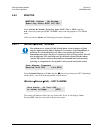
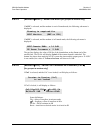
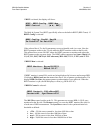
If the user selects Stats, the following sub-menu is displayed:
Select View, Clear-All, or Config, using the ◄ ► arrow keys, then press ENT.
(MonitorStatsView) – VIEW LINK STATISTICS
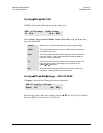
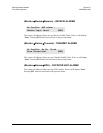
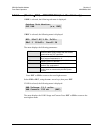
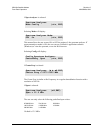
If the user selects VIEW, the following screen is displayed:
The user may scroll backwards or forwards through the entries in the statistics log, using
the STarrow keys. Pressing ENT or CLR will take the user back to the previous menu.
The event log can store up to 250 events.
The top line of the display indicates the log entry number, and the time and date of the
entry. Note that in accordance with international convention, the date is shown in DAY-
MONTH-YEAR format.
The bottom line of the display shows the statistics data that has been measured and
recorded.
The meaning and format of the numbers is as follows:
Minimum Eb/No, Average Eb/No, Maximum TPLI, Average TPLI
(where TPLI means Transmit Power Level increase, if AUPC is enabled).
The user defines a measurement interval (see MonitorStatsConfig) and during this
interval, Eb/No and TPLI are observed, at a one second rate. At the end of this period, the
average Eb/No is calculated and recorded, and the minimum value seen in the interval.
Similarly, the average TPLI is calculated, along with the highest value seen in the
interval.
Notes: If the demod has lost lock during the measurement interval, the minimum Eb/No
will show ‘Loss’ rather than indicate a value. However, the average value (while the
demod was locked) will still be calculated and shown. If, on the other hand, the
demodulator has been unlocked for the entire measurement interval, the average Eb/No
will also show ‘Loss’. (The display will show ‘Loss, Loss’.)
Link Statistics: View
Clear-All Config (◄ ►,ENT)
Sta198: 02/11/02 10:37:32
16.0, 16.0, 9.0, 9.0 (▲▼,ENT)