CDM-Qx Satellite Modem Revision 5
CnCPerformance Characterization MN/CDMQx.IOM
D–3
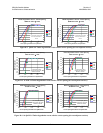
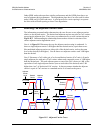
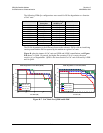
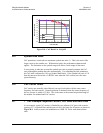
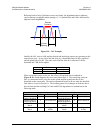
The results are plotted for two equally spaced adjacent carriers each at -3 dB, 0 dB, +3
dB, and +6 dB relative to the desired carrier to produce a family of operating curves.
Figure D-2, through Figure D-4 plot the results for the QPSK, 8-PSK and 16-QAM
cases.
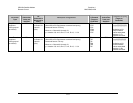
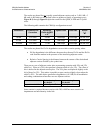
The following table contains the CDM-Qx configurations tested:
Modulation Forward Error
Correction
Reference
Eb/No At BER
≈ 10
-8
Symbol Rate Data Rate Rolloff
(α)
QPSK 3/4 Turbo 3.9 dB 1000 ksps 1500 kbps 20 and 35%
8-PSK 3/4 Turbo 6.3 dB 1000 ksps 2250 kbps 20 and 35%
16-QAM 3/4 Turbo 7.7 dB 1000 ksps 3000 kbps 20 and 35%
The results are plotted for Eb/No degradation versus relative carrier spacing where:
• Eb/No degradation is the difference between the reference Eb/No and the Eb/No
read from the modem in the presence of the interfering adjacent carrier.
• Relative Carrier Spacing is the distance between the centers of the desired and
adjacent carriers divided by the symbol rate.
There are two sets of adjacent carrier plots representing operation with 20% and 35%
rolloff (α). When α is 20%, the spectrum is narrower than it is for 35%. The effect of
this is noticed in the adjacent carrier plots. The 20% plots are displaced slightly to the
left of those for 35%. This makes it possible to space carriers slightly closer when the
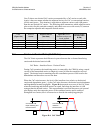
rolloff is 20%. The table below generalizes degradation (≤ 0.5 dB) for all modulation
and coding combinations when there are two adjacent carriers:
Carrier Spacing For
20% Rolloff
Carrier Spacing For
35% Rolloff
Degradation ≤ 0.5 dB
≥ 1.1 x Symbol Rate
≥ 1.2 x Symbol Rate
Some caution is required because carriers with 20% rolloff are more sensitive to
impairments and non-linearity in the link.


