


CDM-Qx Satellite Modem Revision 5
CnCPerformance Characterization MN/CDMQx.IOM
D–5
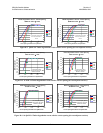
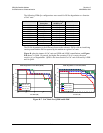
Other QPSK turbo code rates have similar performance and the QPSK plots above are
used to estimate their performance. The degradation plots above are also used for other
turbo 8-PSK and 16-QAM code rates. A good practice for carrier spacing is to operate
the links with sufficient spacing so there is no degradation.
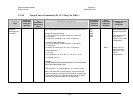
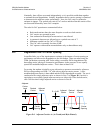
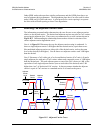
D.3 Selecting The Adjacent Carrier Curve
The information presented earlier characterizes the case for one or two adjacent carriers
relative to the desired carrier. The desired and adjacent carriers may also be CnC carriers
occupying the adjacent slots. These cases are summarized by several variants shown in
Figure D-5. Understanding the relationship between these assists in selection of the
correct adjacent carrier degradation curve.
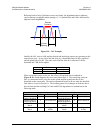
Case A in Figure D-5 illustrates the way the adjacent carrier testing is conducted. It
shows a single adjacent carrier 3 dB higher than the desired carrier, equivalent to two
like-modulated adjacent carriers on either side of the desired carrier, each at the same
level as the desired (0 dB higher). Case B shows two adjacent carriers each 3 dB higher
than the desired.
Case C illustrates a CnC with a pair of co-located desired carriers (CnC ratio is 0) and a
single adjacent slot with pair of CnC carriers whose total composite power is 3 dB higher
than the desired pair. The total adjacent power to one of the CnC carriers is 6 dB, or the
equivalent of two single adjacent carriers (one on each side of the desired) each 3 dB
higher than “one” of the desired CnC carriers. It does not matter whether the adjacent
carrier is a pair of CnC carriers or a standard carrier. It is based on the power.
Carrier
Spacing
Adjacent
Carrier
Level
Desired
Carrier
Desired
Carrier(s)
R = +3 dB
R = +3 dB
A
B
D
R = +3 dB
Desired
Carrier(s)
C
R = +3 dB
Adjacent
Carrier
Adjacent
Carrier
Desired
Carrier
Figure D-5. Adjacent Carrier Cases