


AMD Confidential
User Manual November 21
st
, 2008
Chapter 10: CPU Debugger 147
10 CPU Debugger
10.1 Using the CPU Debugger
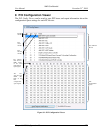
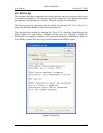
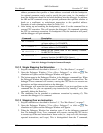
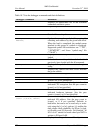
The CPU Debugger provides a list of commands and their descriptions when the “?”
command is typed in the bottom line of the debug window, shown in Figure 10-1.
Figure 10-1: CPU Debugger Window
10.1.1 Setting a Breakpoint
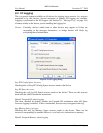
1. Stop the simulation as described in Section 3.1, “Tool Bar Buttons”, on page 7.
2. Open the Debugger Window (“View→Show Debugger”) or click on . The
simulation will pause and the Debugger Window will appear.
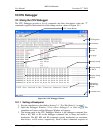
3. The bottom pane in the CPU Debugger Window is the debugger command line.
Enter a BX, BM, or BI on the debugger command line to setup and enable a
breakpoint. The BX, BM, and BI commands specify breakpoints on execution,
data access, or I/O access, respectively. Each of these commands requires an
CPU Registers
Disassembly
Memory Dump
Memory Dump
in ASCII
Information
and Message
Output
Command Line
Instruction
Opcode
cs:[r][e]ip
Memory Dump
Address
CPU Attach Button