


AMD Confidential
User Manual November 21
st
, 2008
148 Chapter 10: CPU Debugger
address parameter that specifies a linear address associated with the breakpoint.
An optional parameter can be used to specify the pass count, i.e., the number of
times the breakpoint should be hit before breaking into the debugger. In addition,
the BM and BI commands accept an optional parameter that specifies whether to
break on a read/input, or write/output transaction to the specified address.
Examples of each command are shown in Table 10-1.
4. After setting up and enabling the breakpoint(s), enter G on the command line to
resume CPU execution. This will execute the debugger's Go command, returning
the CPU to continuous execution. If a breakpoint is hit, the simulation will pause,
and the debugger will gain attention.
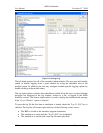
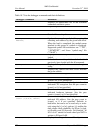
Command
Description
BX 1234abcd
Break on the next execution of the instruction located
at linear address, 0x1234ABCD.
BX 1234ABCD 2
Break on the third execution of the instruction located
at linear address, 0x1234ABCD.
BM abcd1234 r 3
Break on the fourth read of the memory location,
0xABCD1234 (linear).
BM abcd1234 3
Break on the fourth access (read or write) of the
memory location, 0xABCD1234 (linear).
BI 80 w 3
Break on the fourth write to I/O address, 0x80.
Table 10-1: Debugger Breakpoint Command Examples
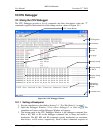
10.1.2 Single Stepping the Simulation
1. Stop the simulation as described in Section 3.1, “Tool Bar Buttons”, on page 7.
2. Open the Debugger Window (“View→Show Debugger”) or click on . The
simulation will pause and the Debugger Window will appear. .
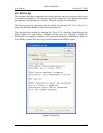
3. The bottom pane in the Debugger Window is the debugger command line. When
the Debugger Window has attention, enter T on the debugger command line. The
debugger Trace command will execute, causing the CPU device to execute one
instruction, and then return attention to the debugger.
4. The debugger will repeat the last entered command, if you just type Enter on the
command line. So, you can repeatedly step instructions by entering T once, then
repeatedly hitting the Enter key.
5. The simulation can be returned to continuous execution by entering G). This
executes the debugger's Go command.
10.1.3 Stepping Over an Instruction
1. Stop the simulation as described in Section 3.1, “Tool Bar Buttons”, on page 7.
2. Open the Debugger Window (“View→Show Debugger”) or click on . The
simulation will pause and the Debugger Window will appear.
3. When the Debugger Window has attention, enter P on the debugger command
line. The debugger Pretty Trace command will execute, causing the CPU device
to execute up to the next instruction in linear order (i.e., step over calls, interrupts,
repeated instructions, and loops). This is distinguished from the T command,