


AMD Confidential
User Manual November 21
st
, 2008
240 Appendix A
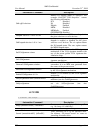
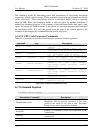
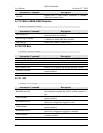
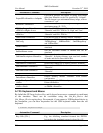
1 simnow> dumpprofile 3
34962861.000000 instructions executed since the last epoch
-------------------------------------------------------------------
Executed 3571672 times
CS.D=0 LongBit=0 physical_addr=00000000000e41de eip=00000000000041de
00000000000041de: cmp [04f0h],aah
00000000000041e3: jnz $-05h
0000000000000000: This block's execution was 20.431234 percent of
the total since the last epoch.
-------------------------------------------------------------------
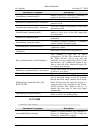
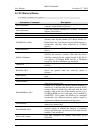
Executed 229430 times
CS.D=0 LongBit=0 physical_addr=000000000002fd99 eip=000000000000fd99
000000000000fd99: lodsb ds:[esi]
000000000000fd9b: add ah,al
000000000000fd9d: loop $-04h
0000000000000020: This block's execution was 1.968632 percent of
the total since the last epoch.
-------------------------------------------------------------------
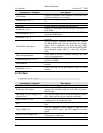
Executed 178599 times
CS.D=0 LongBit=0 physical_addr=00000000000274b2 eip=00000000000074b2
00000000000074b2: mov ax,[5724h]
00000000000074b5: cmp ax,[371ah]
00000000000074b9: jbe $+61h
0000000000000040: This block's execution was 1.532475 percent of
the total since the last epoch.
The simulator contains a code profiling facility that is accessed through the dumpprofile
automation command. There is no graphical user interface to the profiling facility at this
time. Profiling in the simulator has some limitations and features not present in most
systems. The limitations are that no symbolic information is present in the output and that
only execution since the beginning of the last epoch (see the last paragraph for an
explanation of an epoch) is measured. The feature which is most unusual is that the user
can ask for a profile at any time, there is no profiling mechanism that needs to be enabled
before execution takes place. Another feature is that all code in the system is profiled,
even code executed with interrupts off, and code in all modes (16 bit mode, 32-bit legacy
mode, 32-bit compatibility mode, long mode, SMM mode, etc.) is measured equally.
This profiling mechanism is non-intrusive, no x86 interrupts are taken and profiling does
not affect the target machine's selection of code paths at all.
The dumpprofile command by itself causes all profile blocks to be displayed. This output
can be quite voluminous. The user can select just the most frequently executing blocks by
using an optional numeric argument. For example, "dumpprofile 10" will dump the ten
most frequently executing blocks. Blocks are ordered by their frequency of execution, not
weighted by the number of instructions in a block. Therefore, a short block executing 100
times will be displayed before a long block executing 99 times. In this example, the short
block represents fewer total instructions executed. The sense of time that the simulator
uses is quite simple, each instruction takes one "instruction count", with REP instructions
taking one extra count per iteration. Therefore, profiles from the simulator can differ
substantially from those obtained from other tools.