


AMD Confidential
User Manual November 21
st
, 2008
30 Chapter 3: Graphical User Interface
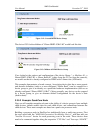
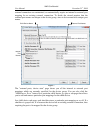
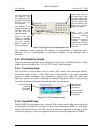
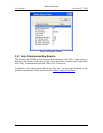
Figure 3-16: Progress Meter and Diagnostic Ports
The simulation counter measures the number of microseconds of simulated time.
However, it is not a performance or cycle-based simulator, so the simulated time is
estimated.
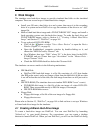
3.4.2 CPU-Statistics Graphs
There are several graphs that can be displayed on the left side of the Main Window. These
graphs can be activated by the “View→CPU Graphs” menu selection.
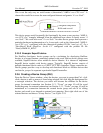
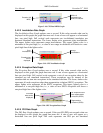
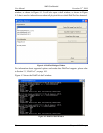
3.4.2.1 Translation Graph
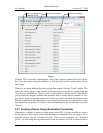
The Translation Graph updates once a second. Full vertical scale means the address-
Translation cache (tcache) is full. Dark color on the bottom of the graph represents
percent of tcache containing valid translations. Lighter color above the dark color
represents percent of tcache containing invalidated translations. Black color growing
from the top represents the meta data that describes the translations.
Figure 3-17: CPU Translation Graph
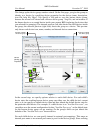
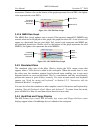
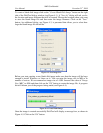
3.4.2.2 Real MIPS Graph
The Real MIPS Graph updates once a second. If this value exceeds what can be displayed
on this graph, the graph line turns red. It shows the instantaneous MIPS, i.e., how many
millions of instructions per host CPU-second at which the simulator is running. A value
of zero will appear as a one-pixel-high horizontal line. Full scale represents 100 MIPS.
Meta Data that
describes the
Translations.
Percent of tcache
containing
Invalidated
Translations.
Percent of tcache
containing Valid
Translations.
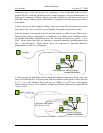
Host Seconds shows
the number of user
and system seconds
of host CPU time the
simulator has uses
since it started.
Sim Seconds is the
number of seconds of
simulated time that
has past since the
simulator started.
MIPS are the total
number of simulated
instructions executed
since the simulator
started, divided by
the Hosts Seconds.
MIPS are the
instantaneous value of
the simulators
performance, its
dimension is millions of
simulated instruction
executed per second of
host user and system
CPU time.
These three lines of
four bytes each show
the values written to the
diagnostic programmed
I/O ports. Mostly these
ports are written by the
BIOS and low-level
diagnostic software.