


4-6 Parametric Graphing
8304PARA.DOC TI-83 international English Bob Fedorisko Revised: 02/19/01 12:17 PM Printed: 02/19/01 1:36
PM Page 6 of 8
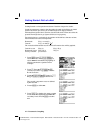
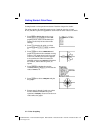
To display the current graph format settings, press
y
[
FORMAT
]. Chapter 3 describes the format settings in detail.
The other graphing modes share these format settings;
Seq
graphing mode has an additional axes format setting.
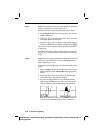
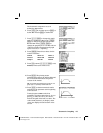
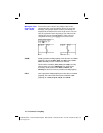
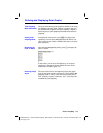
When you press
s
, the TI
-
83 plots the selected
parametric equations. It evaluates the
X and Y components
for each value of
T (from Tmin to Tmax in intervals of
Tstep), and then plots each point defined by X and Y. The
window variables define the viewing window.
As the graph is plotted,
X, Y, and T are updated.
Smart Graph applies to parametric graphs (Chapter 3).
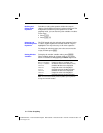
You can perform these actions from the home screen or a
program.
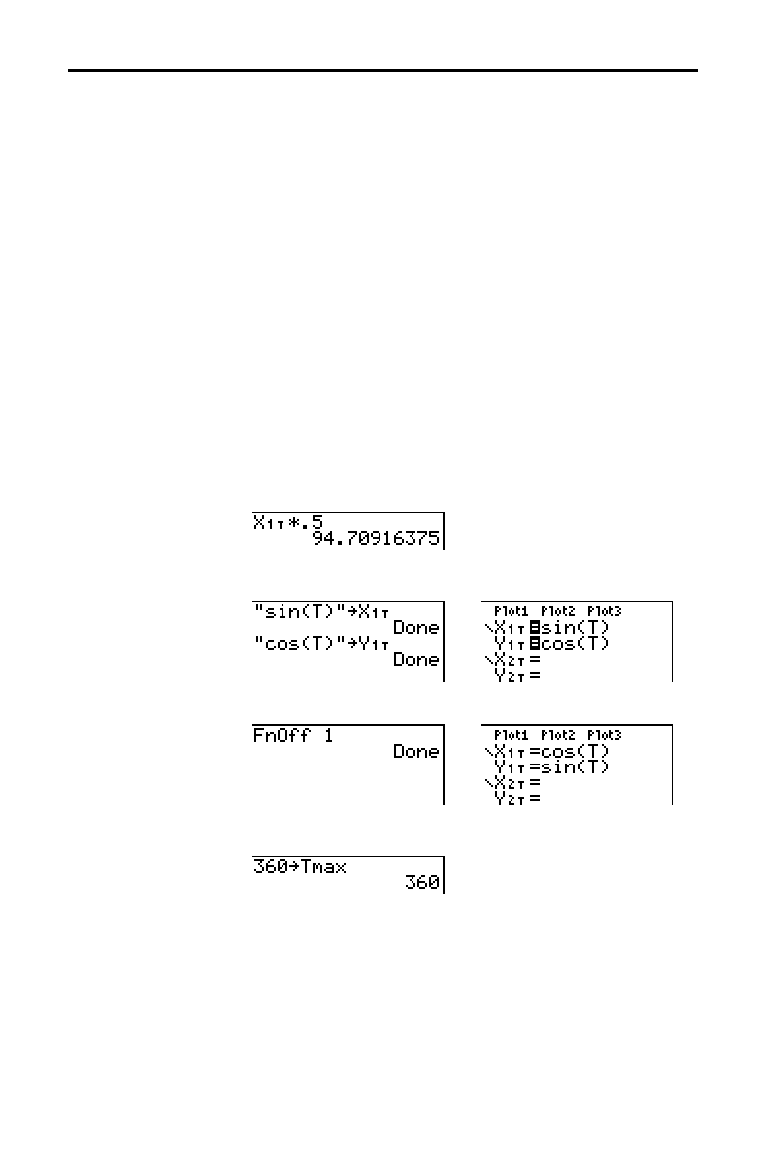
•
Access functions by using the name of the
X or Y
component of the equation as a variable.
•
Store parametric equations.
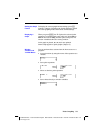
•
Select or deselect parametric equations.
•
Store values directly to window variables.
Setting the Graph
Format
Displaying a
Graph
Window
Variables and
Y-VARS Menus