


Inferential Statistics and Distributions 13-3
8313INFE.DOC TI-83 international English Bob Fedorisko Revised: 02/19/01 12:47 PM Printed: 02/19/01 1:38 PM
Page 3 of 36
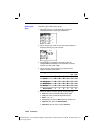
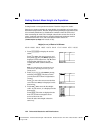
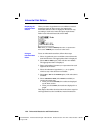
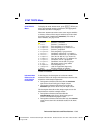
4. Press
…
|
to display the
STAT TESTS
menu, and then press
†
until 8:TInterval is
highlighted.
5. Press
Í
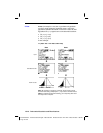
to select 8:TInterval. The
inferential stat editor for
TInterval is
displayed. If
Data is not selected for Inpt:,
press
|
Í
to select
Data.
Press
†
and [
H
] [
G
] [
H
] [
T
] at the List:
prompt (alpha-lock is on).
Press
†
†
Ë
99 to enter a 99 percent
confidence level at the
C
.
Level: prompt.
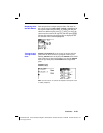
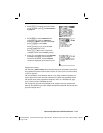
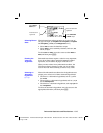
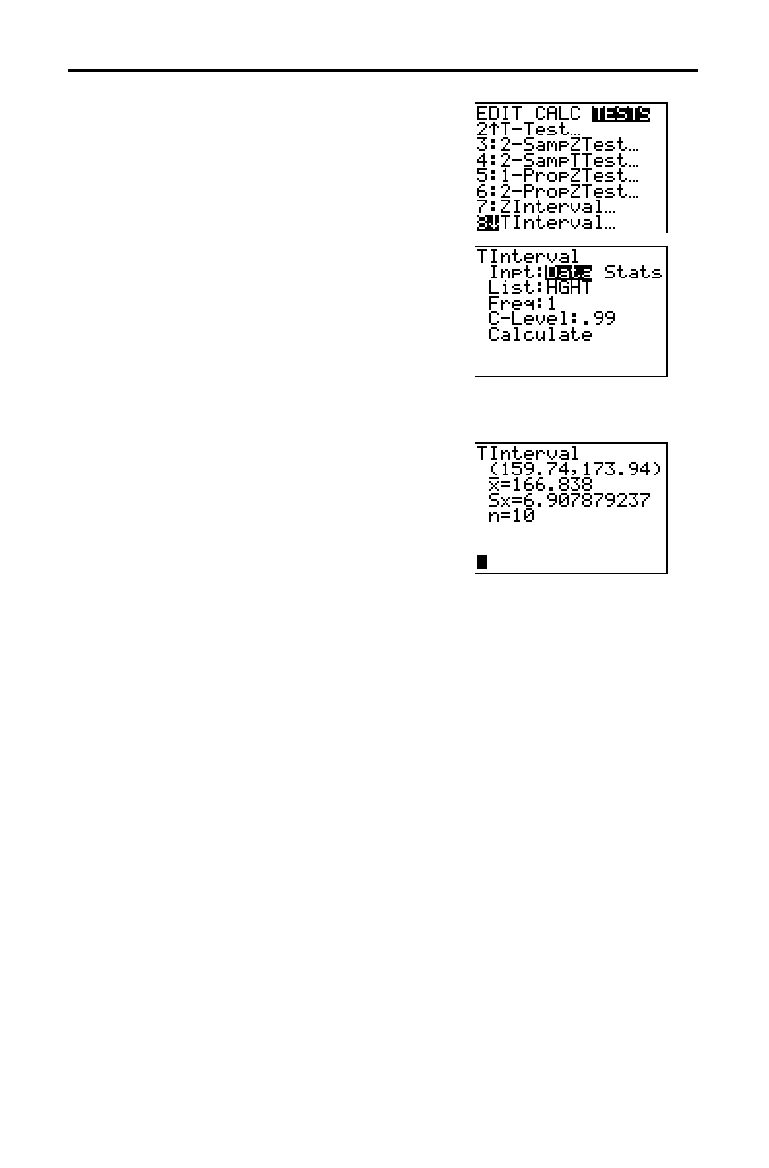
6. Press
†
to move the cursor onto Calculate,
and then press
Í
. The confidence
interval is calculated, and the
TInterval
results are displayed on the home screen.
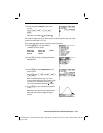
Interpret the results.
The first line,
(159.74,173.94), shows that the 99 percent confidence interval for
the population mean is between about 159.74 cm. and 173.94 cm. This is about
a 14.2 cm. spread.
The .99 confidence level indicates that in a very large number of samples, we
expect 99 percent of the intervals calculated to contain the population mean.
The actual mean of the population sampled is 165.1 cm. (introduction; page
13
.
2), which is in the calculated interval.
The second line gives the mean height of the sample
þ
used to compute this
interval. The third line gives the sample standard deviation
Sx. The bottom line
gives the sample size
n.