


17-8 Applications
8317APPS.DOC TI-83 international English Bob Fedorisko Revised: 02/19/01 1:00 PM Printed: 02/19/01 1:39 PM
Page 8 of 20
Using Web format, you can identify points with attracting
and repelling behavior in sequence graphing.
1. Press
z
. Select
Seq and the default mode settings.
Press
y
[
FORMAT
]. Select Web format and the default
format settings.
2. Press
o
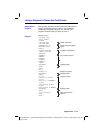
. Clear all functions and turn off all stat plots.
Enter the sequence that corresponds to the expression
Y = K X(1
N
X).
u(
n
)=Ku(
n
N
1)(1
N
u(
n
N
1))
u(
n
Min)=.01
3. Press
y
[
QUIT
] to return to the home screen, and then
store
2.9 to K.
4. Press
p
. Set the window variables.
n
Min=0 Xmin=0 Ymin=
M
.26
n
Max=10 Xmax=1 Ymax=1.1
PlotStart=1 Xscl=1 Yscl=1
PlotStep=1
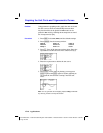
5. Press
r
to display the graph, and then press
~
to
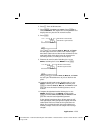
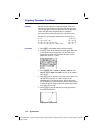
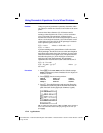
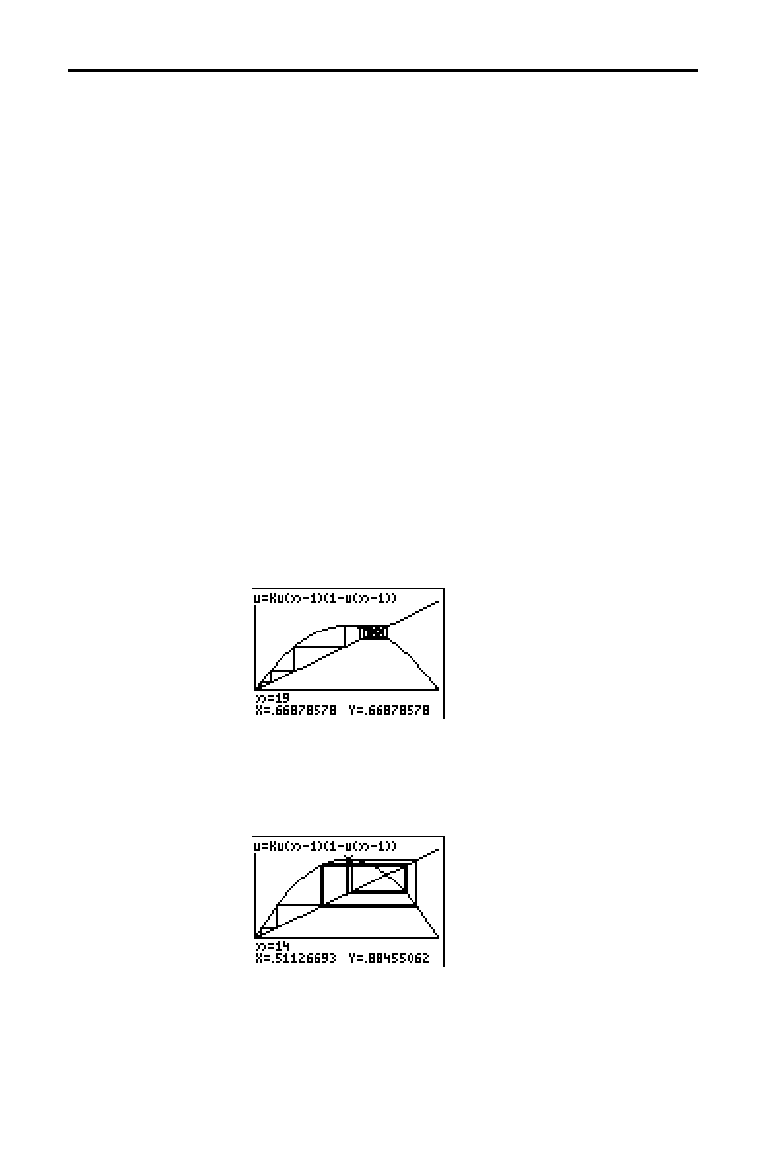
trace the cobweb. This is a cobweb with one attractor.
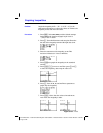
6. Change K to 3.44 and trace the graph to show a cobweb
with two attractors.
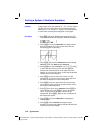
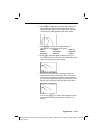
7. Change
K to 3.54 and trace the graph to show a cobweb
with four attractors.
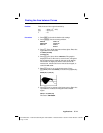
Graphing Cobweb Attractors
Problem
Procedure