


12-34 Statistics
8312STAT.DOC TI-83 international English Bob Fedorisko Revised: 02/19/01 12:42 PM Printed: 02/19/01 1:37
PM Page 34 of 38
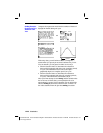
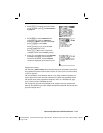
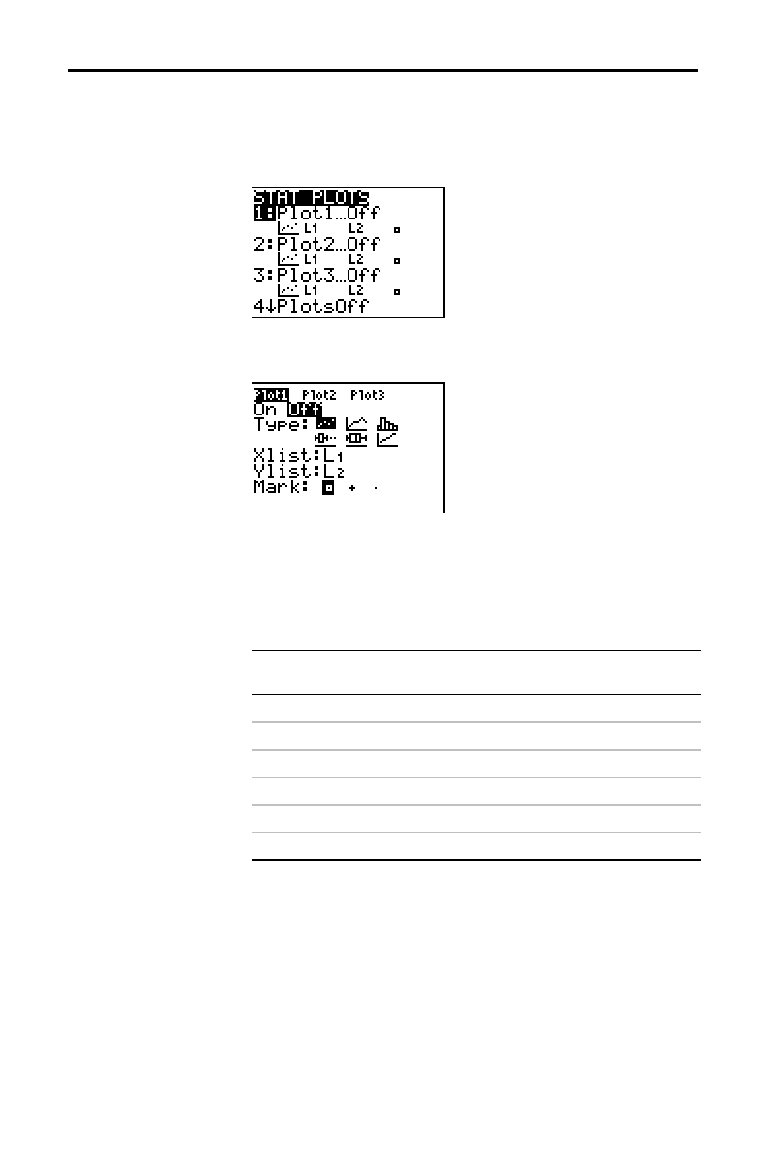
To define a plot, follow these steps.
1. Press
y
[
STAT PLOT
]. The
STAT PLOTS
menu is
displayed with the current plot definitions.
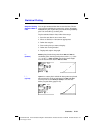
2. Select the plot you want to use. The stat plot editor is
displayed for the plot you selected.
3. Press
Í
to select On if you want to plot the
statistical data immediately. The definition is stored
whether you select
On or Off.
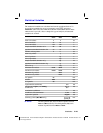
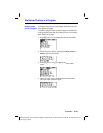
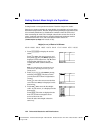
4. Select the type of plot. Each type prompts for the
options checked in this table.
Plot Type
XList YList Mark Freq
Data
List
Data
Axis
"
Scatter
œœœ
Ó
xyLine
œœœ
Ò
Histogram
œœœœ
Õ
ModBoxplot
œœœ
Ö
Boxplot
œœœœ
Ô
NormProbPlot
œœœ
5. Enter list names or select options for the plot type.
•
Xlist (list name containing independent data)
•
Ylist (list name containing dependent data)
•
Mark (
›
or + or
¦
)
•
Freq (frequency list for Xlist elements; default is 1)
•
Data List (list name for NormProbPlot)
•
Data Axis (axis on which to plot Data List)
Defining the
Plots