


Function Graphing 3-15
8303FUNC.DOC TI-83 international English Bob Fedorisko Revised: 02/19/01 12:16 PM Printed: 02/19/01 1:35
PM Page 15 of 28
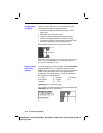
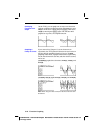
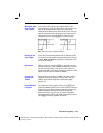
To display the graph of the selected function or functions,
press
s
.
TRACE
,
ZOOM
instructions, and
CALC
operations display the graph automatically. As the TI
-
83
plots the graph, the busy indicator is on. As the graph is
plotted,
X and Y are updated.
While plotting a graph, you can pause or stop graphing.
•
Press
Í
to pause; then press
Í
to resume.
•
Press
É
to stop; then press
s
to redraw.
Smart Graph is a TI
-
83 feature that redisplays the last
graph immediately when you press
s
, but only if all
graphing factors that would cause replotting have
remained the same since the graph was last displayed.
If you performed any of these actions since the graph was
last displayed, the TI
-
83 will replot the graph based on new
values when you press
s
.
•
Changed a mode setting that affects graphs
•
Changed a function in the current picture
•
Selected or deselected a function or stat plot
•
Changed the value of a variable in a selected function
•
Changed a window variable or graph format setting
•
Cleared drawings by selecting
ClrDraw
•
Changed a stat plot definition
Displaying Graphs
Displaying a New
Graph
Pausing or
Stopping a Graph
Smart Graph