


Function Graphing 3-11
8303FUNC.DOC TI-83 international English Bob Fedorisko Revised: 02/19/01 12:16 PM Printed: 02/19/01 1:35
PM Page 11 of 28
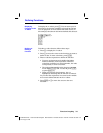
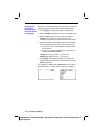
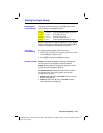
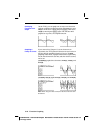
The viewing window is the portion of the coordinate plane
defined by
Xmin, Xmax, Ymin, and Ymax. Xscl (X scale)
defines the distance between tick marks on the x-axis.
Yscl
(Y scale) defines the distance between tick marks on the
y-axis. To turn off tick marks, set
Xscl=0 and Yscl=0.
Xmax
Ymin
Ymax
Xscl
Yscl
Xmin
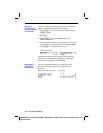
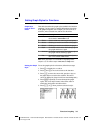
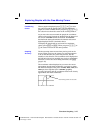
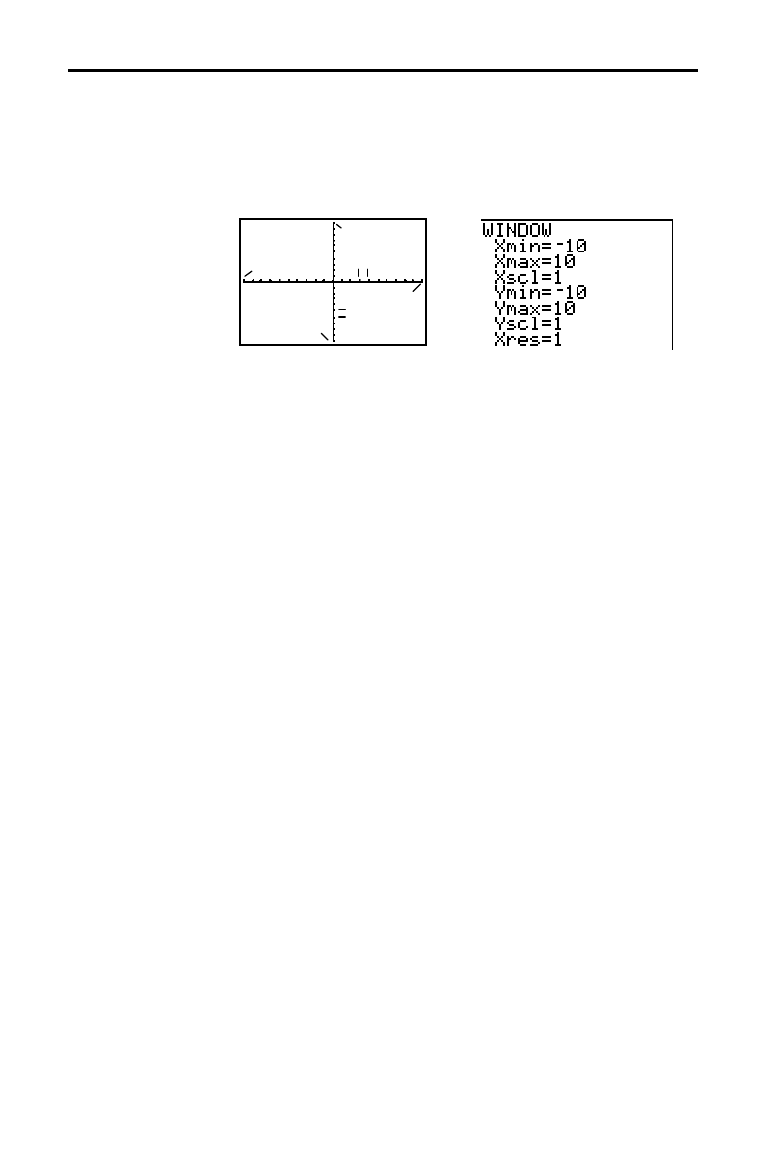
To display the current window variable values, press
p
. The window editor above and to the right shows
the default values in
Func graphing mode and Radian angle
mode. The window variables differ from one graphing
mode to another.
Xres sets pixel resolution (1 through 8) for function graphs
only. The default is
1.
•
At
Xres=1, functions are evaluated and graphed at each
pixel on the x-axis.
•
At
Xres=8, functions are evaluated and graphed at every
eighth pixel along the x-axis.
Tip:
Small
Xres
values improve graph resolution but may cause the
TI
-
83 to draw graphs more slowly.
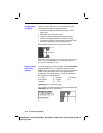
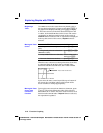
To change a window variable value from the window
editor, follow these steps.
1. Press
†
or
}
to move the cursor to the window
variable you want to change.
2. Edit the value, which can be an expression.
•
Enter a new value, which clears the original value.
•
Move the cursor to a specific digit, and then edit it.
3. Press
Í
,
†
, or
}
. If you entered an expression, the
TI
-
83 evaluates it. The new value is stored.
Note:
Xmin
<
Xmax
and
Ymin
<
Ymax
must be true in order to graph.
Setting the Viewing Window Variables
The TI-83 Viewing
Window
Displaying the
Window
Variables
Changing a
Window Variable
Value