


Inferential Statistics and Distributions 13-5
8313INFE.DOC TI-83 international English Bob Fedorisko Revised: 02/19/01 12:47 PM Printed: 02/19/01 1:38 PM
Page 5 of 36
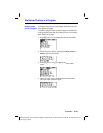
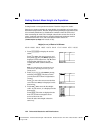
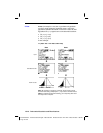
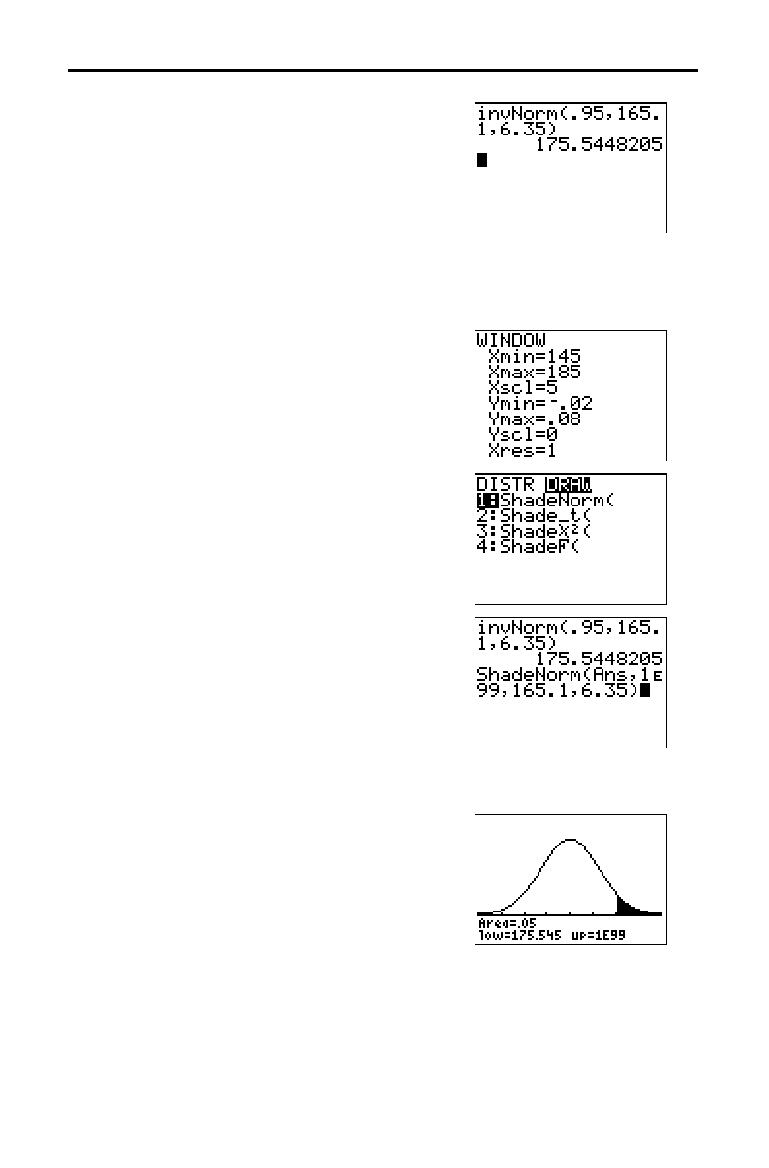
11. Press 3 to paste invNorm( to the home
screen.
Press
Ë
95
¢
165
Ë
1
¢
6
Ë
35
¤
Í
.
.95 is the area, 165.1 is
µ
, and 6.35 is
σ
.
The result is displayed on the home screen; it shows that five percent of the
women are taller than 175.5 cm.
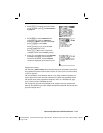
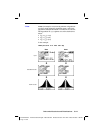
Now graph and shade the top 5 percent of the population.
12. Press
p
and set the window
variables to these values.
Xmin=145 Ymin=
L
.02 Xres=1
Xmax=185 Ymax=.08
Xscl=5 Yscl=0
13. Press
y
[
DISTR
]
~
to display the
DISTR
DRAW
menu.
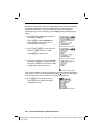
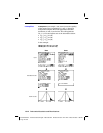
14. Press
Í
to paste ShadeNorm( to the
home screen.
Press
y
[
ANS
]
¢
1
y
[
EE
] 99
¢
165
Ë
1
¢
6
Ë
35
¤
.
Ans (175.5448205 from step 11) is the
lower bound. 1
å
99 is the upper bound. The
normal curve is defined by a mean
µ
of
165.1 and a standard deviation
σ
of 6.35.
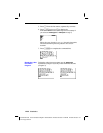
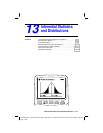
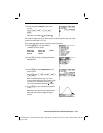
15. Press
Í
to plot and shade the normal
curve.
Area is the area above the 95th percentile.
low is the lower bound. up is the upper
bound.