


12-26 Statistics
8312STAT.DOC TI-83 international English Bob Fedorisko Revised: 02/19/01 12:42 PM Printed: 02/19/01 1:37
PM Page 26 of 38
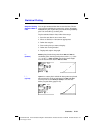
CubicReg (cubic regression) fits the third-degree
polynomial y=ax
3
+bx
2
+cx+d to the data. It displays values
for
a, b, c, and d; when DiagnosticOn is set, it also displays
a value for
R
2
. For four points, the equation is a polynomial
fit; for five or more, it is a polynomial regression. At least
four points are required.
CubicReg [
Xlistname
,
Ylistname
,
freqlist
,
regequ
]
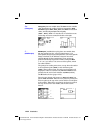
QuartReg (quartic regression) fits the fourth-degree
polynomial y=ax
4
+bx
3
+cx
2
+dx+e to the data. It displays
values for
a, b, c, d, and e; when DiagnosticOn is set, it also
displays a value for
R
2
. For five points, the equation is a
polynomial fit; for six or more, it is a polynomial
regression. At least five points are required.
QuartReg [
Xlistname
,
Ylistname
,
freqlist
,
regequ
]
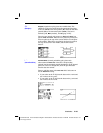
LinReg(a+bx) (linear regression) fits the model equation
y=a+bx to the data using a least-squares fit. It displays values
for
a (y-intercept) and b (slope); when DiagnosticOn is set, it
also displays values for
r
2
and r.
LinReg(a+bx) [
Xlistname
,
Ylistname
,
freqlist
,
regequ
]
LnReg (logarithmic regression) fits the model equation
y=a+b ln(x) to the data using a least-squares fit and
transformed values ln(x) and y. It displays values for
a and
b; when DiagnosticOn is set, it also displays values for r
2
and r.
LnReg [
Xlistname
,
Ylistname
,
freqlist
,
regequ
]
ExpReg (exponential regression) fits the model equation
y=ab
x
to the data using a least-squares fit and transformed
values x and ln(y). It displays values for
a and b; when
DiagnosticOn is set, it also displays values for r
2
and r.
ExpReg [
Xlistname
,
Ylistname
,
freqlist
,
regequ
]
CubicReg
(ax
3
+bx
2
+cx+d)
QuartReg
(ax
4
+bx
3
+cx
2
+
dx+e)
LinReg
(a+bx)
LnReg
(a+b ln(x))
ExpReg
(ab
x
)