


17-2 Applications
8317APPS.DOC TI-83 international English Bob Fedorisko Revised: 02/19/01 1:00 PM Printed: 02/19/01 1:39 PM
Page 2 of 20
An experiment found a significant difference between boys
and girls pertaining to their ability to identify objects held
in their left hands, which are controlled by the right side of
their brains, versus their right hands, which are controlled
by the left side of their brains. The TI Graphics team
conducted a similar test for adult men and women.
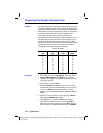
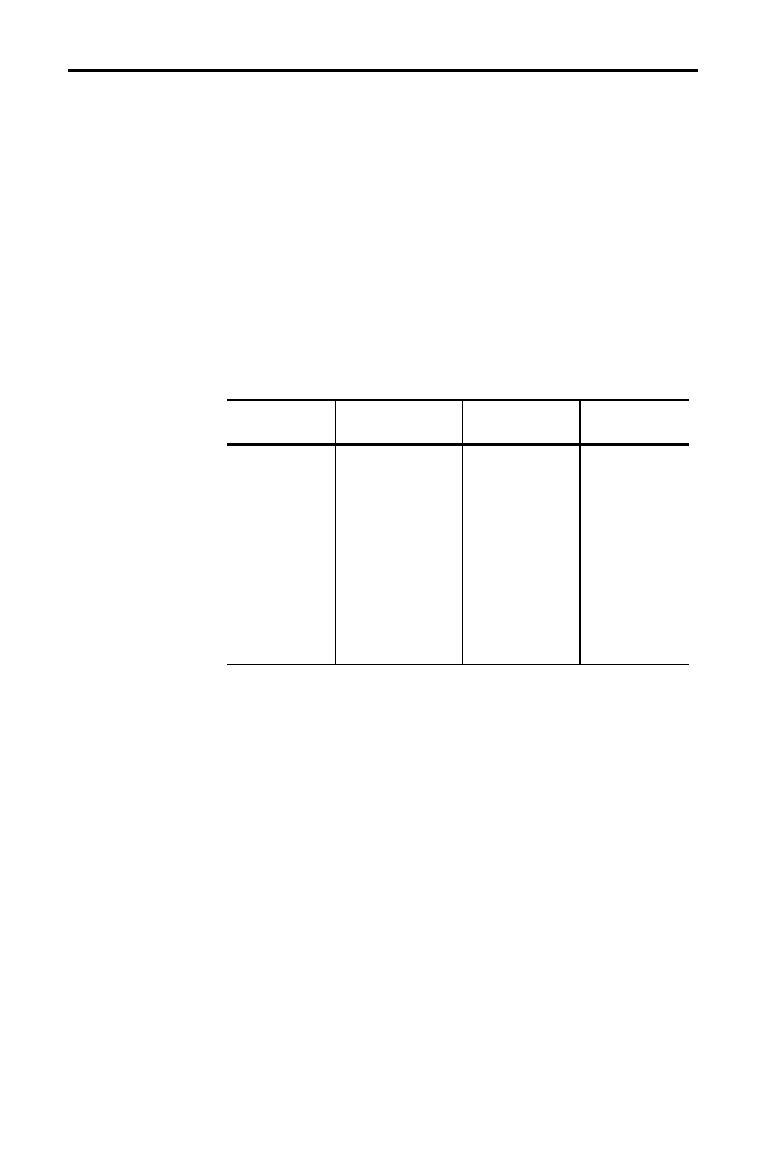
The test involved 30 small objects, which participants were
not allowed to see. First, they held 15 of the objects one by
one in their left hands and guessed what they were. Then
they held the other 15 objects one by one in their right hands
and guessed what they were. Use box plots to compare
visually the correct-guess data from this table.
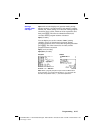
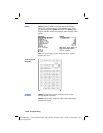
Correct Guesses
Women
Left
Women
Right
Men
Left
Men
Right
84 712
91 86
12 8 7 12
11 12 5 12
10 11 7 7
811 811
12 13 11 12
712 48
9111012
11 12 14 11
13 9
59
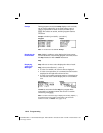
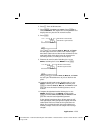
1. Press
…
5
to select
5:SetUpEditor
. Enter list names
WLEFT
,
WRGHT
,
MLEFT
, and
MRGHT
, separated by
commas. Press
Í
. The stat list editor now contains
only these four lists.
2. Press
…
1
to select
1:Edit
.
3. Enter into
WLEFT
the number of correct guesses each
woman made using her left hand (
Women Left
). Press
~
to move to
WRGHT
and enter the number of correct
guesses each woman made using her right hand (
Women
Right
).
4. Likewise, enter each man’s correct guesses in
MLEFT
(
Men Left)
and
MRGHT
(
Men Right
).
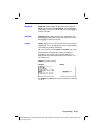
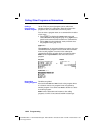
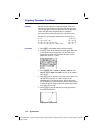
5. Press
y
[
STAT PLOT
]. Select
1:Plot1
. Turn on plot 1;
define it as a modified box plot
Õ
that uses
WLEFT
.
Move the cursor to the top line and select
Plot2
. Turn on
plot 2; define it as a modified box plot that uses
WRGHT
.
Comparing Test Results Using Box Plots
Problem
Procedure