


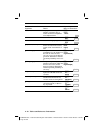
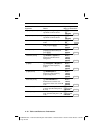

A-18 Tables and Reference Information
8399APXA.DOC TI-83 international English Bob Fedorisko Revised: 02/19/01 1:25 PM Printed: 02/19/01 1:40 PM
Page 18 of 58
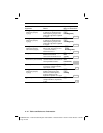
Function or Instruction/
Arguments Result
Key or Keys/
Menu or Screen/Item
Output(
row
,
column
,"
text
")
Displays
text
beginning at
specified
row
and
column
.
†
I/O
6:Output(
16
-
19
Output(
row
,
column
,
value
)
Displays
value
beginning at
specified
row
and
column
.
†
I/O
6:Output(
16
-
19
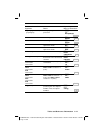
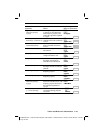
Param
Sets parametric graphing
mode.
†
z
Par
1
-
11
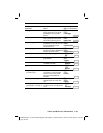
Pause
Suspends program execution
until you press
Í
.
†
CTL
8:Pause
16
-
12
Pause
[
value
] Displays
value
; suspends
program execution until you
press
Í
.
†
CTL
8:Pause
16
-
12
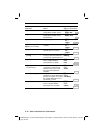
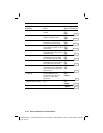
Plot
#
(
type
,
Xlistname
,
Ylistname
,
mark
)
Defines
Plot
#
(
1
,
2
, or
3
) of
type
Scatter
or
xyLine
for
X
listname
and
Ylistname
using
mark
.
†
y
[
STAT PLOT
]
PLOTS
1:Plot1(
2:Plot2(
3:Plot3(
12
-
37
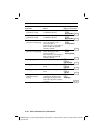
Plot
#
(
type
,
Xlistname
,
freqlist
)
Defines
Plot
#
(
1
,
2
, or
3
) of
type
Histogram
or
Boxplot
for
X
listname
with frequency
f
reqlist
.
†
y
[
STAT PLOT
]
PLOTS
1:Plot1(
2:Plot2(
3:Plot3(
12
-
37
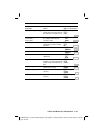
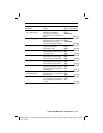
Plot
#
(
type
,
Xlistname
,
freqlist
,
mark
)
Defines
Plot
#
(
1
,
2
, or
3
) of
type
ModBoxplot
for
X
listname
with frequency
f
reqlist
using
mark
.
†
y
[
STAT PLOT
]
PLOTS
1:Plot1(
2:Plot2(
3:Plot3(
12
-
37
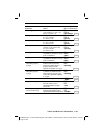
Plot
#
(
type
,
datalistname
,
data axis
,
mark
)
Defines
Plot
#
(
1
,
2
, or
3
) of
type
NormProbPlot
for
datalistname
on
data axis
using
mark
.
data axis
can be
X
or
Y
.
†
y
[
STAT PLOT
]
PLOTS
1:Plot1(
2:Plot2(
3:Plot3(
12
-
37
PlotsOff
[
1,2,3
] Deselects all stat plots or one
or more specified stat plots (
1
,
2
, or
3
).
y
[
STAT PLOT
]
STAT PLOTS
4:PlotsOff
12
-
35
PlotsOn
[
1,2,3
] Selects all stat plots or one or
more specified stat plots (
1
,
2
,
or
3
).
y
[
STAT PLOT
]
STAT PLOTS
5:PlotsOn
12
-
35