


6-12 Sequence Graphing
8306SEQN.DOC TI-83 international English Bob Fedorisko Revised: 02/19/01 12:22 PM Printed: 02/19/01 1:36
PM Page 12 of 16
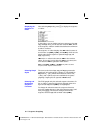
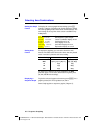
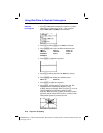
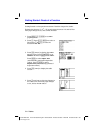
1. Press
o
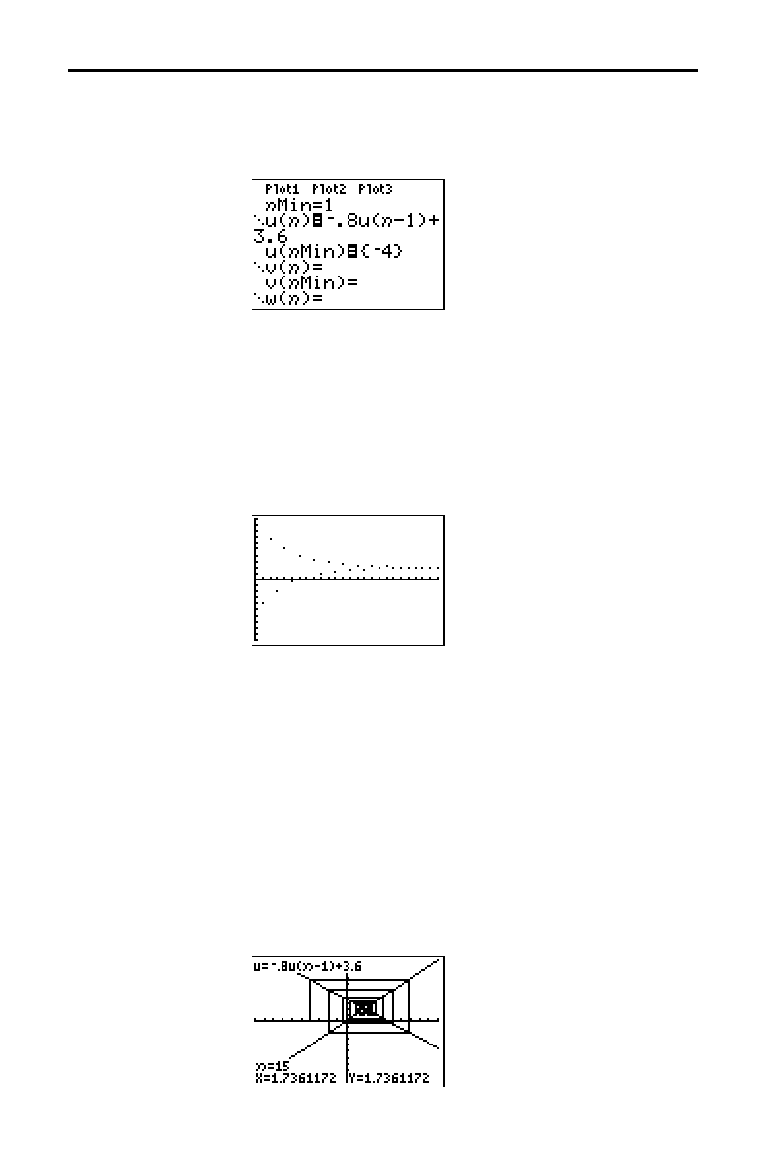
in Seq mode to display the sequence
Y=
editor.
Make sure the graph style is set to
í
(dot), and then
define
n
Min, u(
n
) and u(
n
Min) as shown below.
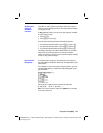
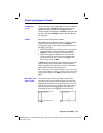
2. Press
y
[
FORMAT
]
Í
to set Time axes format.
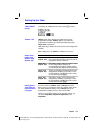
3. Press
p
and set the variables as shown below.
n
Min=1 Xmin=0 Ymin=
L
10
n
Max=25 Xmax=25 Ymax=10
PlotStart=1 Xscl=1 Yscl=1
PlotStep=1
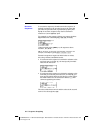
4. Press
s
to graph the sequence.
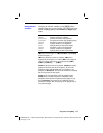
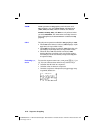
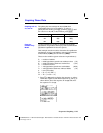
5. Press
y
[
FORMAT
] and select the Web axes setting.
6. Press
p
and change the variables below.
Xmin=
L
10 Xmax=10
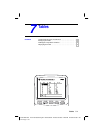
7. Press
s
to graph the sequence.
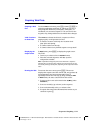
8. Press
r
, and then press
~
to draw the web. The
displayed cursor coordinates
n
, X (u(
n
N
1)
), and
Y (u(
n
)) change accordingly. When you press
~
, a new
n
value is displayed, and the trace cursor is on the
sequence. When you press
~
again, the
n
value remains
the same, and the cursor moves to the
y=x
reference line.
This pattern repeats as you trace the web.
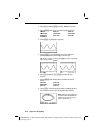
Using Web Plots to Illustrate Convergence
Example:
Convergence