


6-8 Sequence Graphing
8306SEQN.DOC TI-83 international English Bob Fedorisko Revised: 02/19/01 12:22 PM Printed: 02/19/01 1:36
PM Page 8 of 16
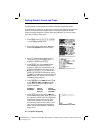
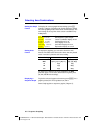
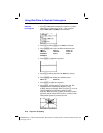
To display the current graph format settings, press
y
[
FORMAT
]. Chapter 3 describes the format settings in detail.
The other graphing modes share these format settings. The
axes setting on the top line of the screen is available only
in
Seq mode.
Time Web uv vw uw
Type of sequence plot (axes)
RectGC PolarGC
Rectangular or polar output
CoordOn CoordOff
Cursor coordinate display on/off
GridOff GridOn
Grid display off or on
AxesOn AxesOff
Axes display on or off
LabelOff LabelOn
Axes label display off or on
ExprOn ExprOff
Expression display on or off
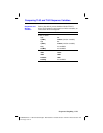
For sequence graphing, you can select from five axes
formats. The table below shows the values that are plotted
on the x-axis and y-axis for each axes setting.
Axes Setting x-axis y-axis
Time
n
u(
n
), v(
n
), w(
n
)
Web u(
n
N
1)
, v(
n
N
1)
, w(
n
N
1) u(
n
), v(
n
), w(
n
)
uv u(
n
)v(
n
)
vw v(
n
)w(
n
)
uw u(
n
)w(
n
)
See pages 6
.
11 and 6
.
12 for more information on Web
plots. See page 6
.
13 for more information on phase plots
(
uv, vw, and uw axes settings).
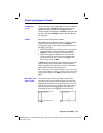
To plot the selected sequence functions, press
s
. As a
graph is plotted, the TI
-
83 updates
X, Y, and
n
.
Smart Graph applies to sequence graphs (Chapter 3).
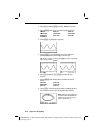
Selecting Axes Combinations
Setting the Graph
Format
Setting Axes
Format
Displaying a
Sequence Graph