


Function Graphing 3-21
8303FUNC.DOC TI-83 international English Bob Fedorisko Revised: 02/19/01 12:16 PM Printed: 02/19/01 1:35
PM Page 21 of 28
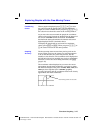
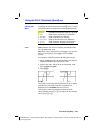
Zoom In magnifies the part of the graph that surrounds the
cursor location.
Zoom Out displays a greater portion of the
graph, centered on the cursor location. The
XFact and
YFact settings determine the extent of the zoom.
To zoom in on a graph, follow these steps.
1. Check
XFact and YFact (page 3
.
24); change as needed.
2. Select
2:Zoom In from the
ZOOM
menu. The zoom
cursor is displayed.
3. Move the zoom cursor to the point that is to be the
center of the new viewing window.
4. Press
Í
. The TI
-
83 adjusts the viewing window by
XFact and YFact; updates the window variables; and
replots the selected functions, centered on the cursor
location.
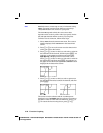
5. Zoom in on the graph again in either of two ways.
•
To zoom in at the same point, press
Í
.
•
To zoom in at a new point, move the cursor to the
point that you want as the center of the new viewing
window, and then press
Í
.
To zoom out on a graph, select
3:Zoom Out and repeat
steps 3 through 5.
To cancel
Zoom In or Zoom Out, press
‘
.
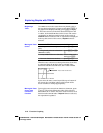
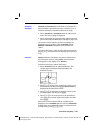
ZDecimal replots the functions immediately. It updates the
window variables to preset values, as shown below. These
values set
@
X and
@
Y equal to 0.1 and set the X and Y value
of each pixel to one decimal place.
Xmin=
L
4.7 Ymin=
L
3.1
Xmax=4.7 Ymax=3.1
Xscl=1 Yscl=1
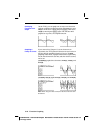
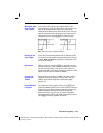
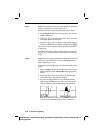
ZSquare
replots the functions immediately. It redefines the
viewing window based on the current values of the
window variables. It adjusts in only one direction so that
@
X=
@
Y
, which makes the graph of a circle look like a circle.
Xscl and Yscl remain unchanged. The midpoint of the
current graph (not the intersection of the axes) becomes
the midpoint of the new graph.
Zoom In,
Zoom Out
ZDecimal
ZSquare