


17-10 Applications
8317APPS.DOC TI-83 international English Bob Fedorisko Revised: 02/19/01 1:00 PM Printed: 02/19/01 1:39 PM
Page 10 of 20
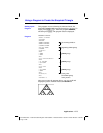
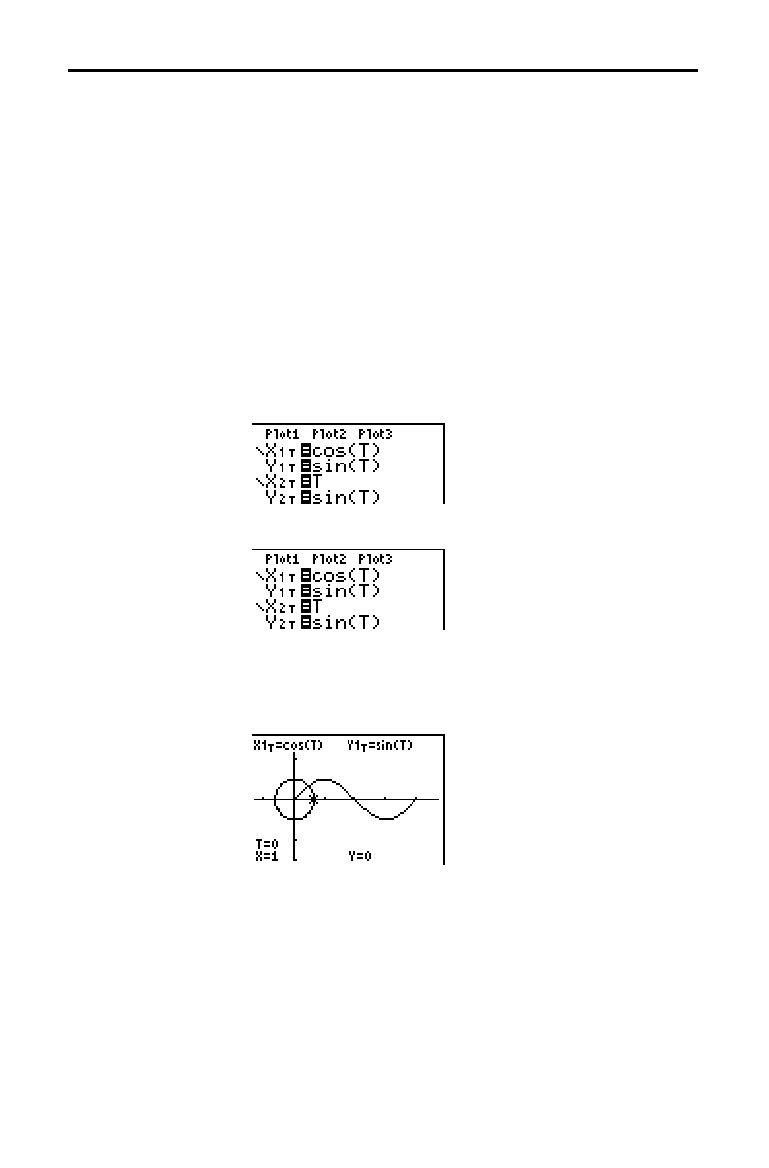
Using parametric graphing mode, graph the unit circle and
the sine curve to show the relationship between them.
Any function that can be plotted in
Func mode can be
plotted in
Par mode by defining the X component as T and
the
Y component as F(T).
1. Press
z
. Select
Par, Simul, and the default settings.
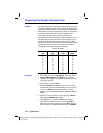
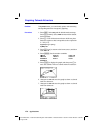
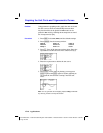
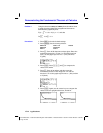
2. Press
p
. Set the viewing window.
Tmin=0 Xmin=
L
2 Ymin=
L
3
Tmax=2
p
Xmax=7.4 Ymax=3
Tstep=.1 Xscl=
pà
2 Yscl=1
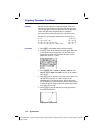
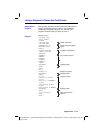
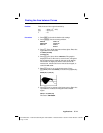
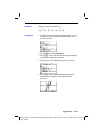
3. Press
o
. Turn off all functions and stat plots. Enter the
expressions to define the unit circle centered on (0,0).
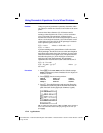
4. Enter the expressions to define the sine curve.
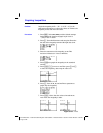
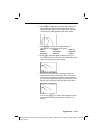
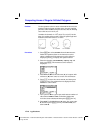
5. Press
r
. As the graph is plotting, you may press
Í
to pause and
Í
again to resume graphing as
you watch the sine function “unwrap” from the unit
circle.
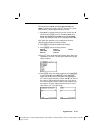
Note:
You can generalize the unwrapping. Replace
sin(T)
in
Y
2T
with
any other trig function to unwrap that function.
Graphing the Unit Circle and Trigonometric Curves
Problem
Procedure