


Applications 17-13
8317APPS.DOC TI-83 international English Bob Fedorisko Revised: 02/19/01 1:00 PM Printed: 02/19/01 1:39 PM
Page 13 of 20
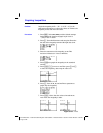
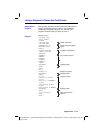
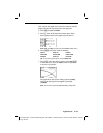
4. Press
s
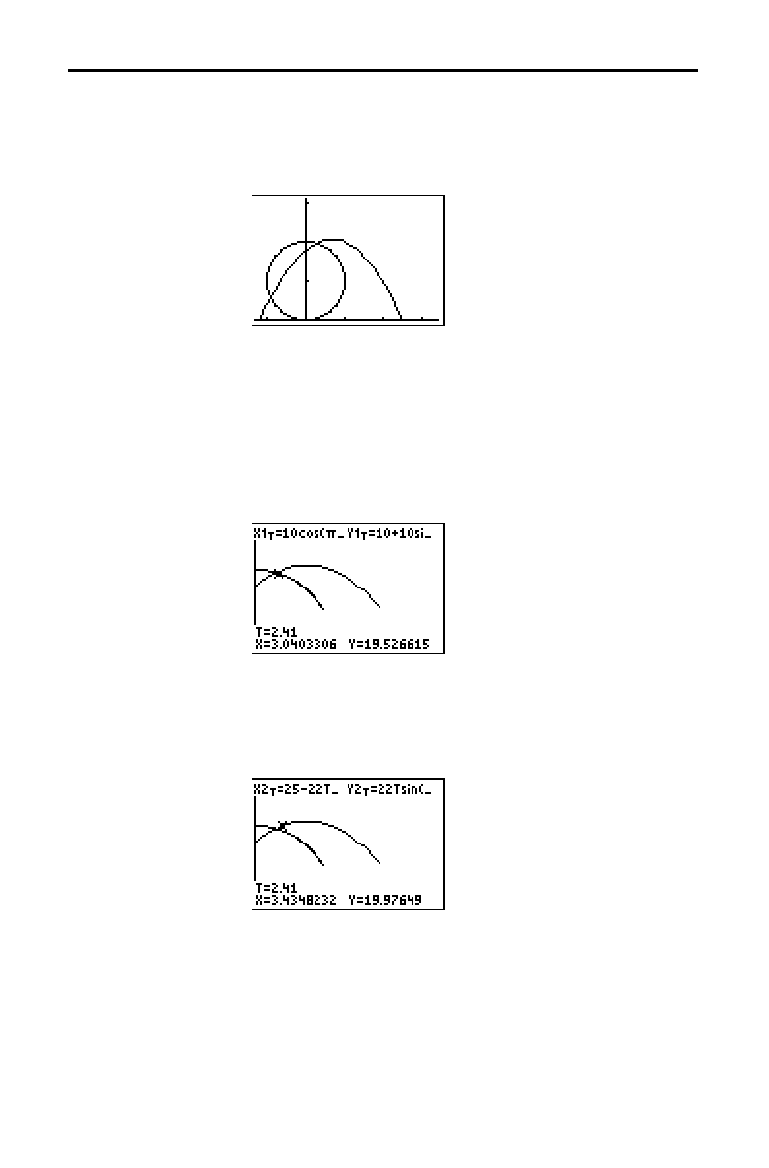
to graph the equations. Watch closely as
they are plotted. Notice that the ball and the ferris
wheel passenger appear to be closest where the paths
cross in the top-right quadrant of the ferris wheel.
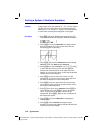
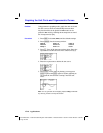
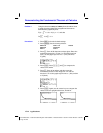
5. Press
p
. Change the viewing window to
concentrate on this portion of the graph.
Tmin=1 Xmin=0 Ymin=10
Tmax=3 Xmax=23.5 Ymax=25.5
Tstep=.03 Xscl=10 Yscl=10
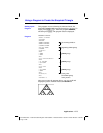
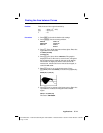
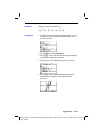
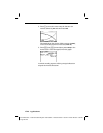
6. Press
r
. After the graph is plotted, press
~
to
move near the point on the ferris wheel where the paths
cross. Notice the values of
X, Y, and T.
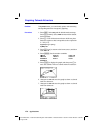
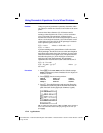
7. Press
†
to move to the path of the ball. Notice the
values of
X and Y (T is unchanged). Notice where the
cursor is located. This is the position of the ball when
the ferris wheel passenger passes the intersection. Did
the ball or the passenger reach the intersection first?
You can use
r
to, in effect, take snapshots in time
and explore the relative behavior of two objects in
motion.