


17-14 Applications
8317APPS.DOC TI-83 international English Bob Fedorisko Revised: 02/19/01 1:00 PM Printed: 02/19/01 1:39 PM
Page 14 of 20
Using the functions fnInt( and nDeriv( from the
MATH
menu
to graph functions defined by integrals and derivatives
demonstrates graphically that:
F(x) =
‰
1
x
1
à
t dt = ln(x), x > 0 and that
D
x
[
‰
1
x
1
à
t dt
]
= 1
à
x
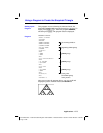
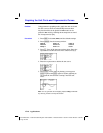
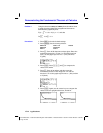
1. Press
z
. Select the default settings.
2. Press
p
. Set the viewing window.
Xmin=.01 Ymin=
M
1.5 Xres=3
Xmax=10 Ymax=2.5
Xscl=1 Yscl=1
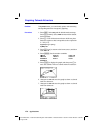
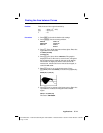
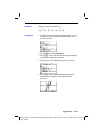
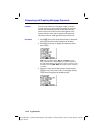
3. Press
o
. Turn off all functions and stat plots. Enter the
numerical integral of 1
à
T from 1 to X and the function
ln(X). Set the graph style for
Y
1
to
ç
(line) and Y
2
to
ë
(path).
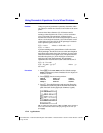
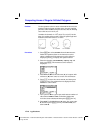
4. Press
r
. Press
|
,
}
,
~
, and
†
to compare the
values of
Y
1
and Y
2
.
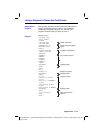
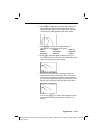
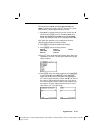
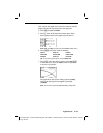
5. Press
o
. Turn off
Y
1
and Y
2
, and then enter the
numerical derivative of the integral of 1
à
X and the
function 1
à
X. Set the graph style for
Y
3
to
ç
(line) and Y
4
to
è
(thick).
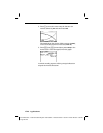
6. Press
r
. Again, use the cursor keys to compare the
values of the two graphed functions,
Y
3
and Y
4
.
Demonstrating the Fundamental Theorem of Calculus
Problem 1
Procedure 1