


Statistics 12-5
8312STAT.DOC TI-83 international English Bob Fedorisko Revised: 02/19/01 12:42 PM Printed: 02/19/01 1:37
PM Page 5 of 38
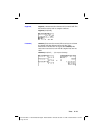
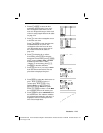
The regression line appears to fit the central portion of the scatter plot well.
However, a residual plot may provide more information about this fit.
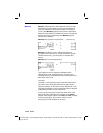
14. Press
…
1 to select 1:Edit. The stat
list editor is displayed.
Press
~
and
}
to move the cursor onto
L
3
.
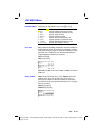
Press
y
[
INS
]. An unnamed column is
displayed in column
3; L
3
, L
4
, L
5
, and L
6
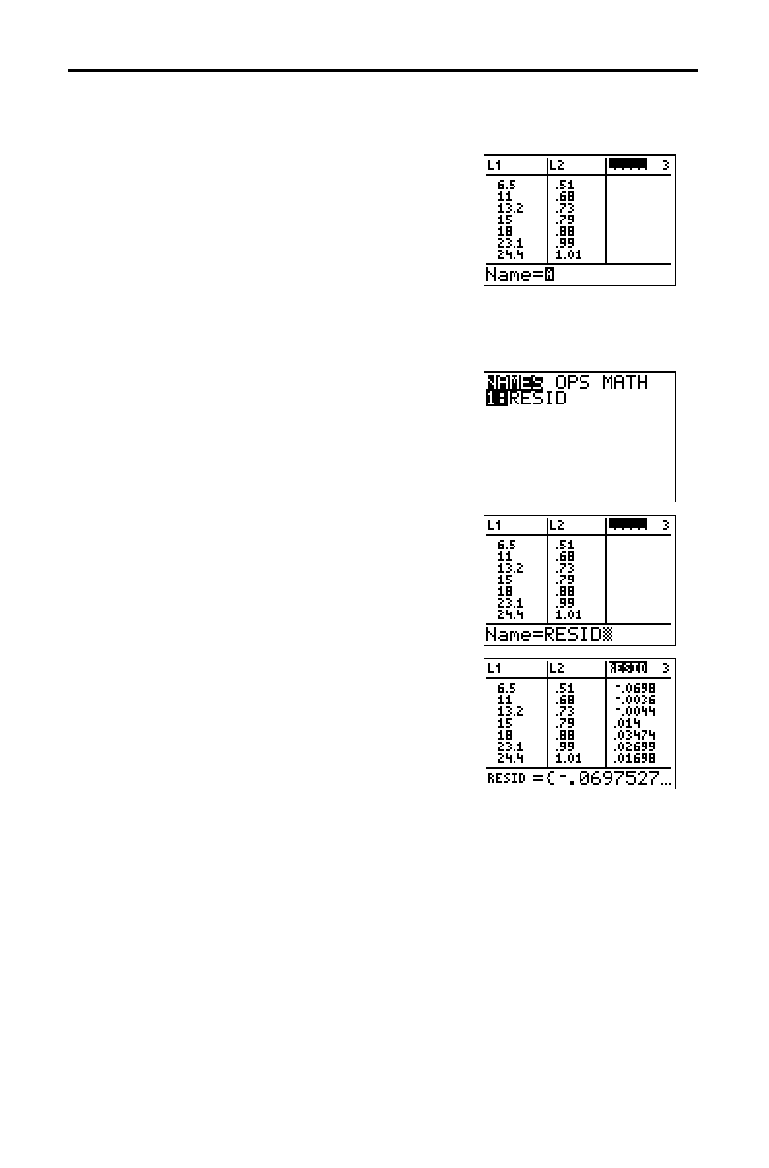
shift right one column. The Name=
prompt is displayed in the entry line, and
alpha-lock is on.
15. Press
y
[
LIST
] to display the
LIST
NAMES
menu.
If necessary, press
†
to move the cursor
onto the list name
RESID.
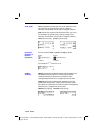
16. Press
Í
to select RESID and paste it
to the stat list editor’s
Name= prompt.
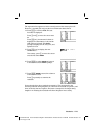
17. Press
Í
. RESID is stored in column 3
of the stat list editor.
Press
†
repeatedly to examine the
residuals.
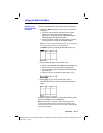
Notice that the first three residuals are negative. They correspond to the
shortest pendulum string lengths in
L
1
. The next five residuals are positive, and
three of the last four are negative. The latter correspond to the longer string
lengths in
L
1
. Plotting the residuals will show this pattern more clearly.