


7-6 Tables
8307TABL.DOC TI-83 international English Bob Fedorisko Revised: 02/19/01 12:26 PM Printed: 02/19/01 1:36
PM Page 6 of 6
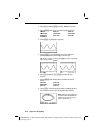
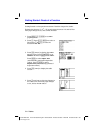
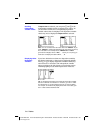
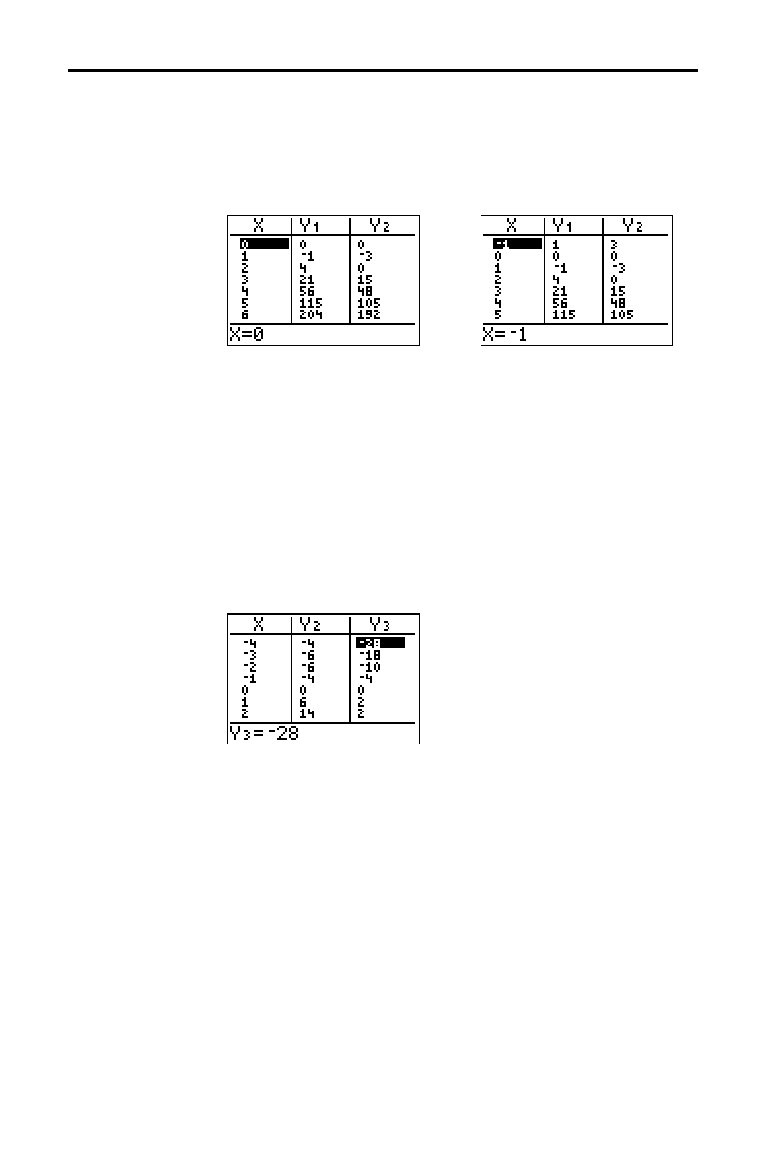
If Indpnt: Auto is selected, you can press
}
and
†
in the
independent-variable column to display more values. As
you scroll the column, the corresponding dependent-
variable values also are displayed. All dependent-variable
values may not be displayed if
Depend: Ask is selected.
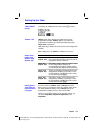
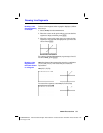
Note:
You can scroll back from the value entered for
TblStart
. As you
scroll,
TblStart
is updated automatically to the value shown on the top
line of the table. In the example above,
TblStart=0
and
@
Tbl=1
generates and displays values of
X=0
, . . . ,
6
; but you can press
}
to
scroll back and display the table for
X=
M
1
, . . .,
5
.
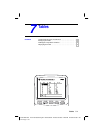
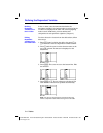
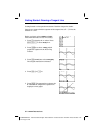
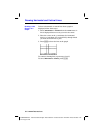
If you have defined more than two dependent variables,
the first two selected
Y=
functions are displayed initially.
Press
~
or
|
to display dependent variables defined by
other selected
Y=
functions. The independent variable
always remains in the left column, except during a trace
with
Par graphing mode and G
.
T split-screen mode set.
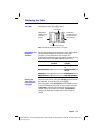
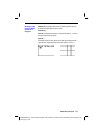
Tip:
To simultaneously display on the table two dependent variables
that are not defined as consecutive Y= functions, go to the Y= editor
and deselect the Y= functions between the two you want to display.
For example, to simultaneously display
Y
4
and
Y
7
on the table, go to
the Y= editor and deselect
Y
5
and
Y
6
.
Scrolling
Independent-
Variable Values
Displaying Other
Dependent
Variables