


Function Graphing 3-17
8303FUNC.DOC TI-83 international English Bob Fedorisko Revised: 02/19/01 12:16 PM Printed: 02/19/01 1:35
PM Page 17 of 28
When a graph is displayed, press
|
,
~
,
}
, or
†
to move
the cursor around the graph. When you first display the
graph, no cursor is visible. When you press
|
,
~
,
}
, or
†
,
the cursor moves from the center of the viewing window.
As you move the cursor around the graph, the coordinate
values of the cursor location are displayed at the bottom of
the screen if
CoordOn format is selected. The Float/Fix
decimal mode setting determines the number of decimal
digits displayed for the coordinate values.
To display the graph with no cursor and no coordinate
values, press
‘
or
Í
. When you press
|
,
~
,
}
, or
†
, the cursor moves from the same position.
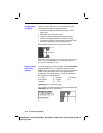
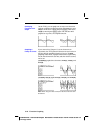
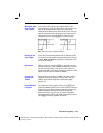
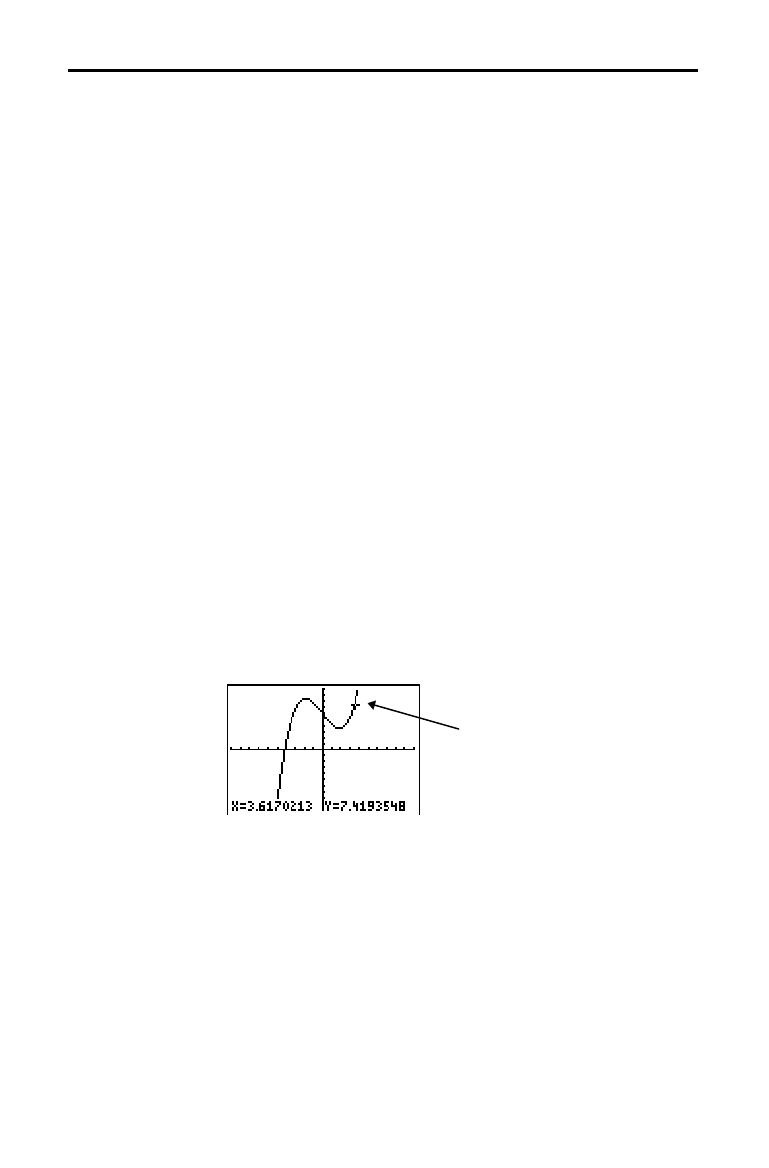
The free-moving cursor moves from pixel to pixel on the
screen. When you move the cursor to a pixel that appears
to be on the function, the cursor may be near, but not
actually on, the function. The coordinate value displayed at
the bottom of the screen actually may not be a point on the
function. To move the cursor along a function, use
r
(page 3
.
18).
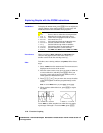
The coordinate values displayed as you move the cursor
approximate actual math coordinates, *accurate to within
the width and height of the pixel. As
Xmin, Xmax, Ymin, and
Ymax get closer together (as in a ZoomIn) graphing
accuracy increases, and the coordinate values more closely
approximate the math coordinates.
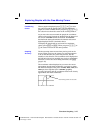
Exploring Graphs with the Free-Moving Cursor
Free-Moving
Cursor
Graphing
Accuracy
Free-moving cursor “on” the curve