


Applications 17-5
8317APPS.DOC TI-83 international English Bob Fedorisko Revised: 02/19/01 1:00 PM Printed: 02/19/01 1:39 PM
Page 5 of 20
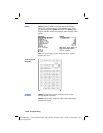
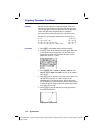
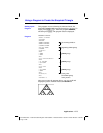
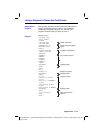
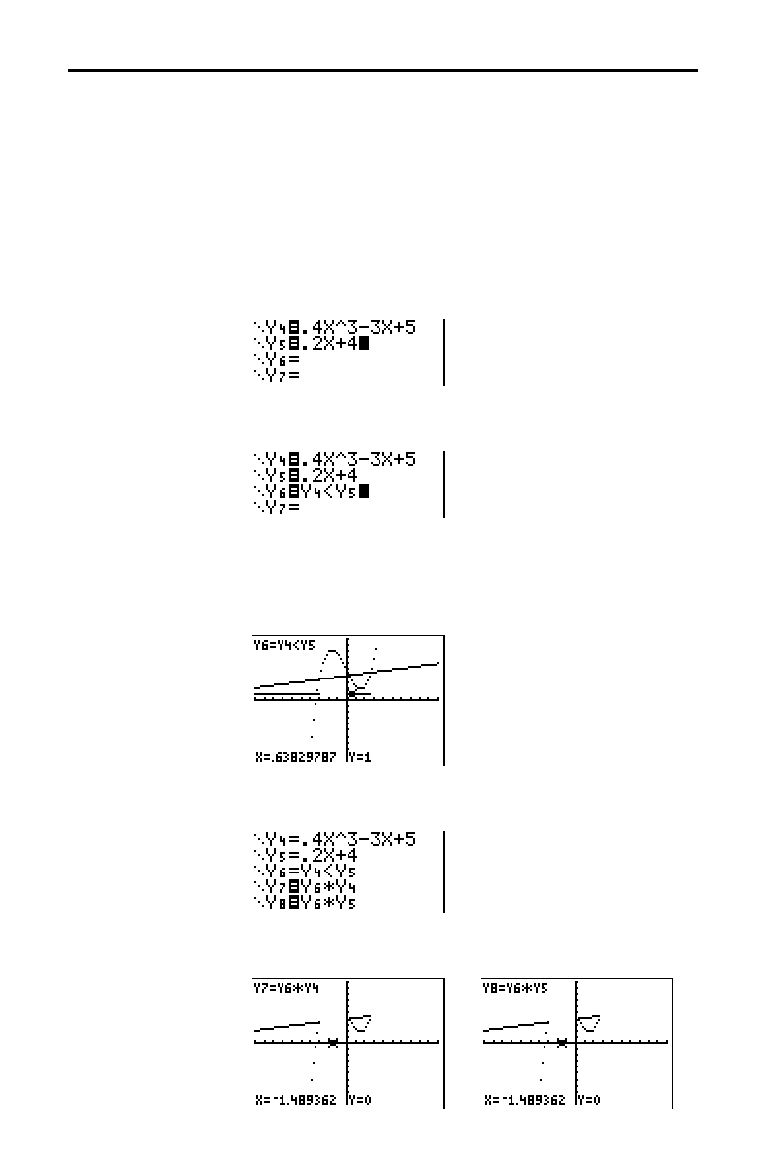
Graph the inequality 0
.
4X
3
N
3X + 5 < 0
.
2X + 4. Use the
TEST
menu operations to explore the values of X where the
inequality is true and where it is false.
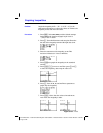
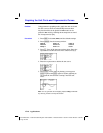
1. Press
z
. Select
Dot, Simul, and the default settings.
Setting
Dot mode changes all graph style icons to
í
(dot) in the
Y=
editor.
2. Press
o
. Turn off all functions and stat plots. Enter the
left side of the inequality as
Y
4
and the right side as Y
5
.
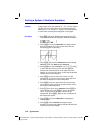
3. Enter the statement of the inequality as Y
6
. This
function evaluates to
1 if true or 0 if false.
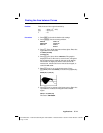
4. Press
q
6 to graph the inequality in the standard
window.
5. Press
r
†
†
to move to
Y
6
. Then press
|
and
~
to trace the inequality, observing the value of
Y.
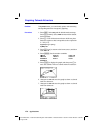
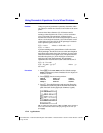
6. Press
o
. Turn off Y
4
, Y
5
, and Y
6
. Enter equations to
graph only the inequality.
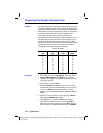
7. Press
r
. Notice that the values of Y
7
and Y
8
are
zero where the inequality is false.
Graphing Inequalities
Problem
Procedure