


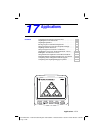
Applications 17-3
8317APPS.DOC TI-83 international English Bob Fedorisko Revised: 02/19/01 1:00 PM Printed: 02/19/01 1:39 PM
Page 3 of 20
6. Press
o
. Turn off all functions.
7. Press
p
. Set
Xscl=1 and Yscl=0. Press
q
9 to
select
9:ZoomStat. This adjusts the viewing window and
displays the box plots for the women’s results.
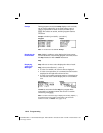
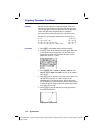
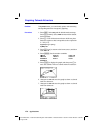
8. Press
r
.
%
Women’s left-hand data
%
Women’s right-hand data
Use
|
and
~
to examine minX, Q
1
, Med, Q
3
, and maxX
for each plot. Notice the outlier to the women’s right-
hand data. What is the median for the left hand? For the
right hand? With which hand were the women more
accurate guessers, according to the box plots?
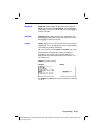
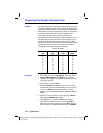
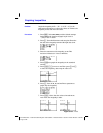
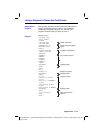
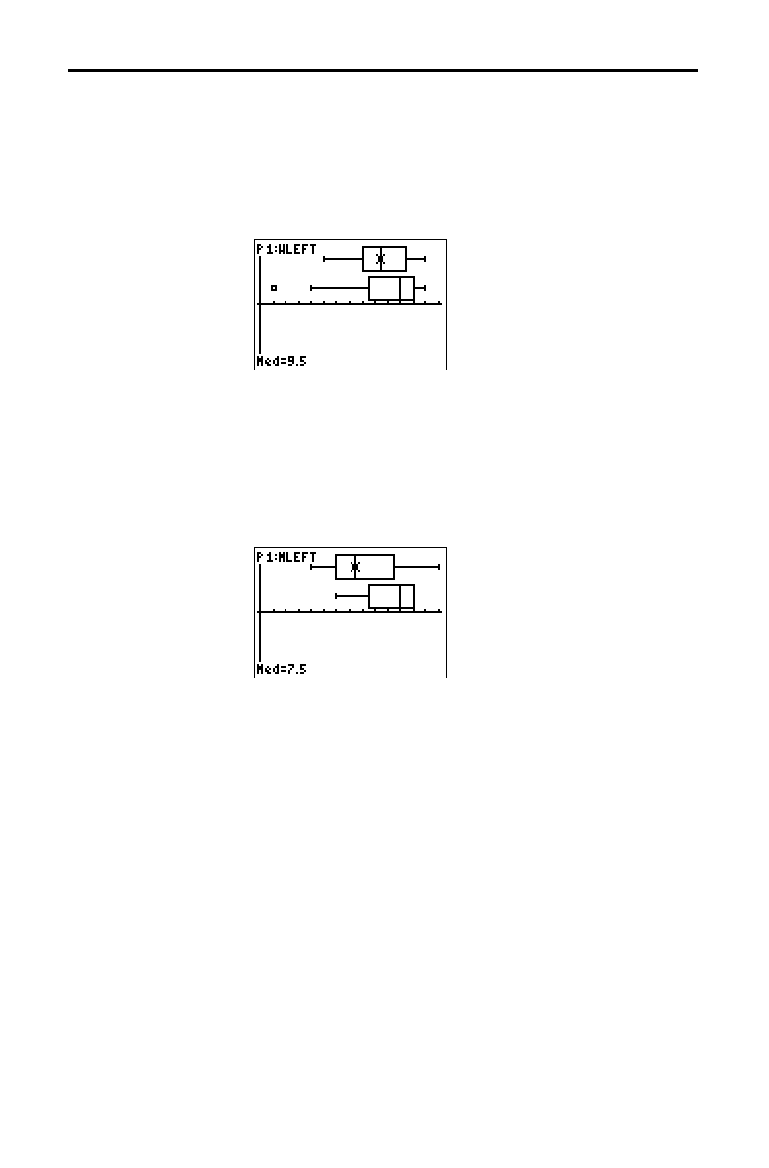
9. Examine the men’s results. Redefine plot 1 to use
MLEFT, redefine plot 2 to use MRGHT. Press
r
.
%
Men’s left-hand data
%
Men’s right-hand data
Press
|
and
~
to examine minX, Q
1
, Med, Q
3
, and maxX
for each plot. What difference do you see between the
plots?
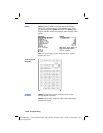
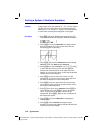
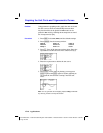
10.Compare the left-hand results. Redefine plot 1 to use
WLEFT, redefine plot 2 to use MLEFT, and then press
r
to examine
minX, Q
1
, Med, Q
3
, and maxX for each
plot. Who were the better left-hand guessers, men or
women?
11.Compare the right-hand results. Define plot 1 to use
WRGHT, define plot 2 to use MRGHT, and then press
r
to examine
minX, Q
1
, Med, Q
3
, and maxX for each
plot. Who were the better right-hand guessers?
In the original experiment boys did not guess as well
with right hands, while girls guessed equally well with
either hand. This is not what our box plots show for
adults. Do you think that this is because adults have
learned to adapt or because our sample was not large
enough?