


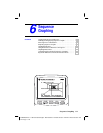

6-2 Sequence Graphing
8306SEQN.DOC TI-83 international English Bob Fedorisko Revised: 02/19/01 12:22 PM Printed: 02/19/01 1:36
PM Page 2 of 16
Getting Started is a fast-paced introduction. Read the chapter for details.
A small forest of 4,000 trees is under a new forestry plan. Each year 20 percent
of the trees will be harvested and 1,000 new trees will be planted. Will the
forest eventually disappear? Will the forest size stabilize? If so, in how many
years and with how many trees?
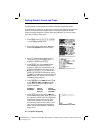
1. Press
z
. Press
†
†
†
~
~
~
Í
to select
Seq graphing mode.
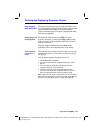
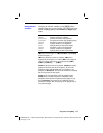
2. Press
y
[
FORMAT
] and select Time axes
format and
ExprOn format if necessary.
3. Press
o
. If the graph-style icon is not
í
(dot), press
|
|
, press
Í
until
í
is
displayed, and then press
~
~
.
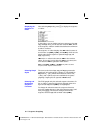
4. Press
~
3 to select iPart( (integer
part) because only whole trees are
harvested. After each annual harvest, 80
percent (.80) of the trees remain. Press
Ë
8
y
[
u
]
£
„
¹
1
¤
to define the
number of trees after each harvest. Press
Ã
1000
¤
to define the new trees. Press
†
4000 to define the number of trees at the
beginning of the program.
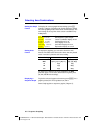
5. Press
p
0 to set
n
Min=0. Press
†
50
to set
n
Max=50.
n
Min and
n
Max evaluate
forest size over 50 years. Set the other
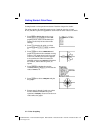
window variables.
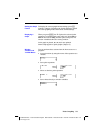
PlotStart=1 Xmin=0 Ymin=0
PlotStep=1 Xmax=50 Ymax=6000
Xscl=10 Yscl=1000
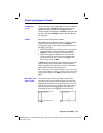
6. Press
r
. Tracing begins at
n
Min (the
start of the forestry plan). Press
~
to trace
the sequence year by year. The sequence is
displayed at the top of the screen. The
values for
n
(number of years), X (X=
n
,
because
n
is plotted on the x-axis), and Y
(tree count) are displayed at the bottom.
When will the forest stabilize? With how
many trees?
Getting Started: Forest and Trees