


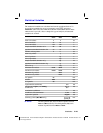
Statistics 12-33
8312STAT.DOC TI-83 international English Bob Fedorisko Revised: 02/19/01 12:42 PM Printed: 02/19/01 1:37
PM Page 33 of 38
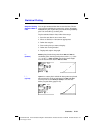
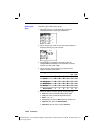
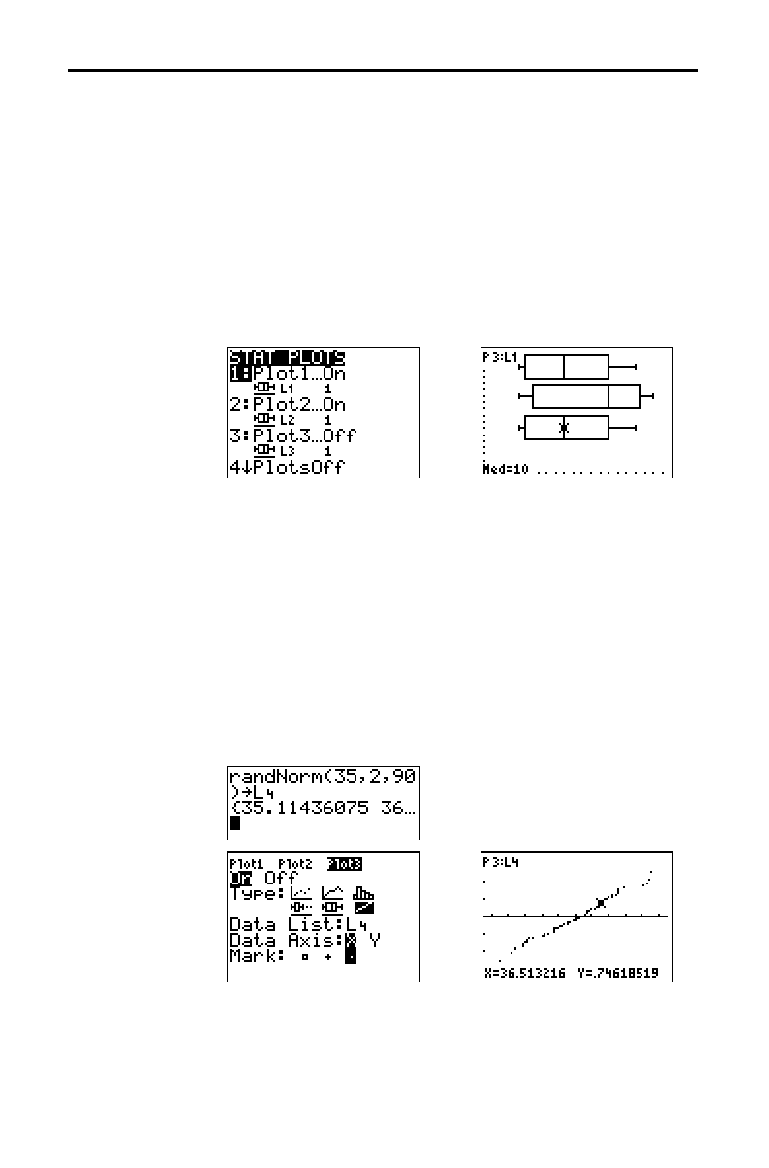
Boxplot (regular box plot) plots one-variable data. The
whiskers on the plot extend from the minimum data point
in the set (
minX) to the first quartile (Q
1
) and from the third
quartile (
Q
3
) to the maximum point (maxX). The box is
defined by
Q
1
, Med (median), and Q
3
(page 12
.
29).
Box plots are plotted with respect to
Xmin and Xmax, but
ignore
Ymin and Ymax. When two box plots are plotted, the
first one plots at the top of the screen and the second plots
in the middle. When three are plotted, the first one plots at
the top, the second in the middle, and the third at the
bottom.
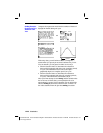
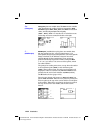
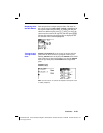
NormProbPlot (normal probability plot) plots each
observation
X in Data List versus the corresponding
quantile
z of the standard normal distribution. If the plotted
points lie close to a straight line, then the plot indicates
that the data are normal.
Enter a valid list name in the
Data List field. Select X or Y
for the Data Axis setting.
•
If you select
X, the TI
-
83 plots the data on the x-axis and
the z-values on the y-axis.
•
If you select
Y, the TI
-
83 plots the data on the y-axis and
the z-values on the x-axis.
Ö
(Boxplot)
Ô
(NormProbPlot)