


3-10 Function Graphing
8303FUNC.DOC TI-83 international English Bob Fedorisko Revised: 02/19/01 12:16 PM Printed: 02/19/01 1:35
PM Page 10 of 28
8303FUNC.DOC TI-83 international English Bob Fedorisko Revised: 02/19/01 12:16 PM Printed: 02/19/01 1:35
PM Page 10 of 28
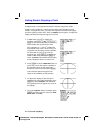
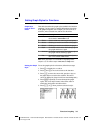
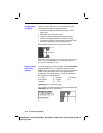
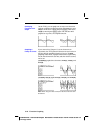
When you select
é
or
ê
for two or more functions, the
TI
-
83 rotates through four shading patterns.
•
Vertical lines shade the first function with a
é
or
ê
graph style.
•
Horizontal lines shade the second.
•
Negatively sloping diagonal lines shade the third.
•
Positively sloping diagonal lines shade the fourth.
•
The rotation returns to vertical lines for the fifth
é
or
ê
function, repeating the order described above.
When shaded areas intersect, the patterns overlap.
Note:
When
é
or
ê
is selected for a Y= function that graphs a family of
curves, such as
Y1={1,2,3}X
, the four shading patterns rotate for
each member of the family of curves.
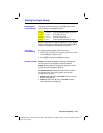
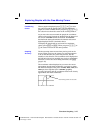
To set the graph style from a program, select
H:GraphStyle(
from the
PRGM CTL
menu. To display this menu, press
while in the program editor.
function#
is the number
of the
Y=
function name in the current graphing mode.
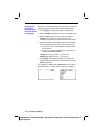
graphstyle#
is an integer from
1
to
7
that corresponds to
the graph style, as shown below.
1
=
ç
(line)
2
=
è
(thick)
3
=
é
(above)
4
=
ê
(below)
5
=
ë
(path)
6
=
ì
(animate)
7
=
í
(dot)
GraphStyle(
function#
,
graphstyle#
)
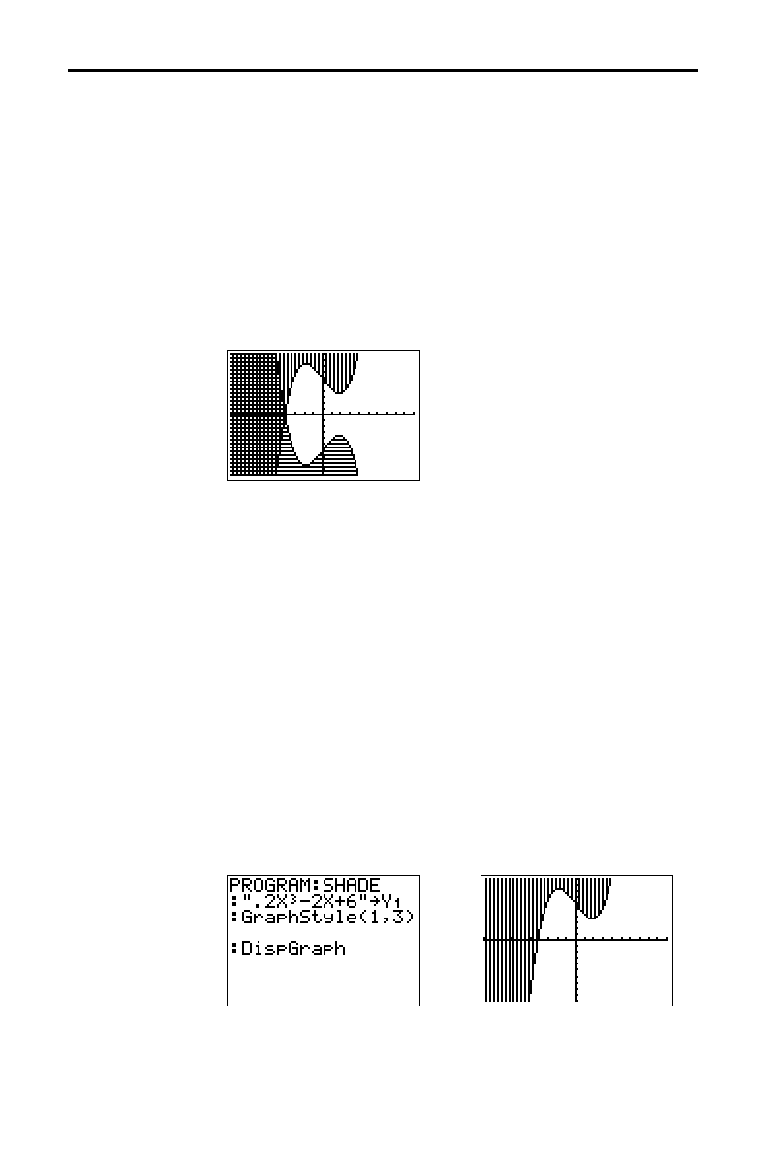
For example, when this program is executed in
Func
mode,
GraphStyle(1,3)
sets
Y
1
to
é
(above).
Shading Above
and Below
Setting a Graph
Style from a
Program