


12-10 Statistics
8312STAT.DOC TI-83 international English Bob Fedorisko Revised: 02/19/01 12:42 PM Printed: 02/19/01 1:37
PM Page 10 of 38
Data for statistical analyses is stored in lists, which you
can create and edit using the stat list editor. The TI
-
83 has
six list variables in memory,
L
1
through L
6
, to which you
can store data for statistical calculations. Also, you can
store data to list names that you create (Chapter 11).
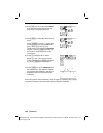
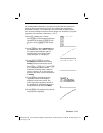
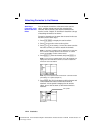
To set up a statistical analysis, follow these steps. Read the
chapter for details.
1. Enter the statistical data into one or more lists.
2. Plot the data.
3. Calculate the statistical variables or fit a model to the data.
4. Graph the regression equation for the plotted data.
5. Graph the residuals list for the given regression model.
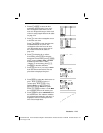
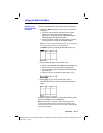
The stat list editor is a table where you can store, edit, and
view up to 20 lists that are in memory. Also, you can create
list names from the stat list editor.
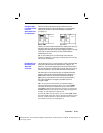
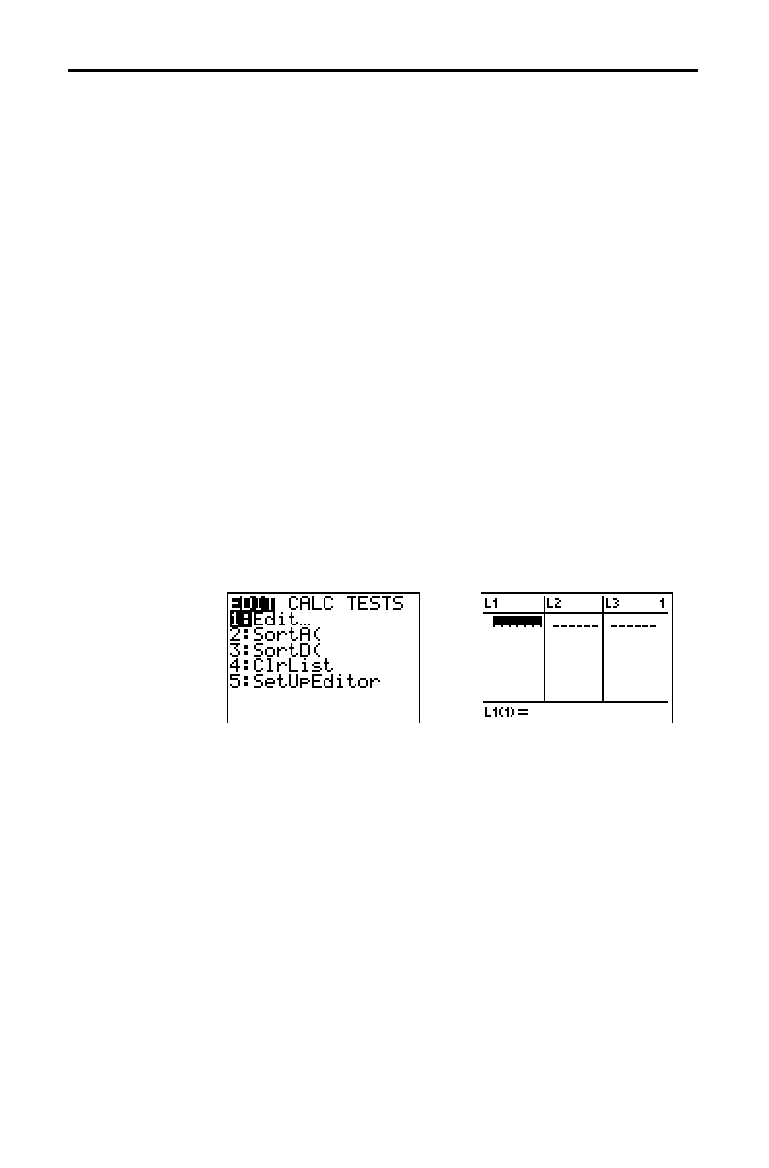
To display the stat list editor, press
…
, and then select
1:Edit from the
STAT EDIT
menu.
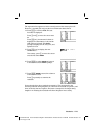
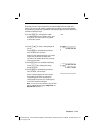
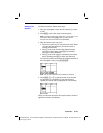
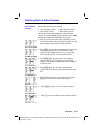
The top line displays list names. L
1
through L
6
are stored in
columns
1 through 6 after a memory reset. The number of
the current column is displayed in the top-right corner.
The bottom line is the entry line. All data entry occurs on
this line. The characteristics of this line change according
to the current context (page 12
.
17).
The center area displays up to seven elements of up to
three lists; it abbreviates values when necessary. The entry
line displays the full value of the current element.
Setting Up Statistical Analyses
Using Lists to
Store Data
Setting Up a
Statistical
Analysis
Displaying the
Stat List Editor