


12-36 Statistics
8312STAT.DOC TI-83 international English Bob Fedorisko Revised: 02/19/01 12:42 PM Printed: 02/19/01 1:37
PM Page 36 of 38
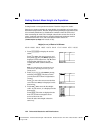
Stat plots are displayed on the current graph. To define the
viewing window, press
p
and enter values for the
window variables.
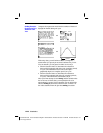
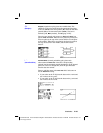
ZoomStat redefines the viewing window
to display all statistical data points.
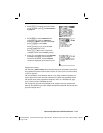
When you trace a scatter plot or xyLine, tracing begins at
the first element in the lists.
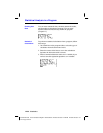
When you trace a histogram, the cursor moves from the
top center of one column to the top center of the next,
starting at the first column.
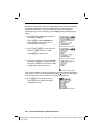
When you trace a box plot, tracing begins at
Med (the
median). Press
|
to trace to
Q
1
and minX. Press
~
to trace
to
Q
3
and maxX.
When you press
}
or
†
to move to another plot or to
another
Y=
function, tracing moves to the current or
beginning point on that plot (not the nearest pixel).
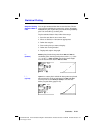
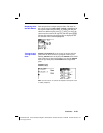
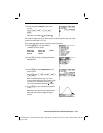
The
ExprOn/ExprOff format setting applies to stat plots
(Chapter 3).When
ExprOn is selected, the plot number and
plotted data lists are displayed in the top-left corner.
Defining the
Viewing Window
Tracing a Stat
Plot