


Inferential Statistics and Distributions 13-35
8313INFE.DOC TI-83 international English Bob Fedorisko Revised: 02/19/01 12:47 PM Printed: 02/19/01 1:38 PM
Page 35 of 36
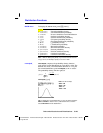
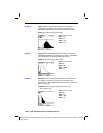
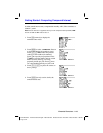
To display the
DISTR DRAW
menu, press
y
[
DISTR
]
~
.
DISTR DRAW
instructions draw various types of density
functions, shade the area specified by
lowerbound
and
upperbound
, and display the computed area value.
To clear the drawings, select
1:ClrDraw from the
DRAW
menu (Chapter 8).
Note
: Before you execute a
DISTR DRAW
instruction, you must set
the window variables so that the desired distribution fits the screen.
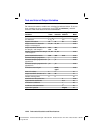
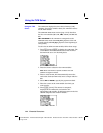
DISTR DRAW
1: ShadeNorm(
Shades normal distribution.
2:Shade_t(
Shades Student-
t
distribution.
3:Shade
c
2
(
Shades
c
2
distribution.
4:Shade
Û
(
Shades
Û
distribution.
Note:
L
1
å
99 and 1
å
99 specify infinity. If you want to view the area left
of
upperbound
, for example, specify
lowerbound
=
L
1
å
99.
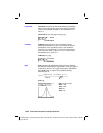
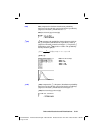
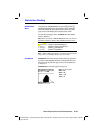
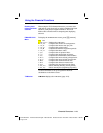
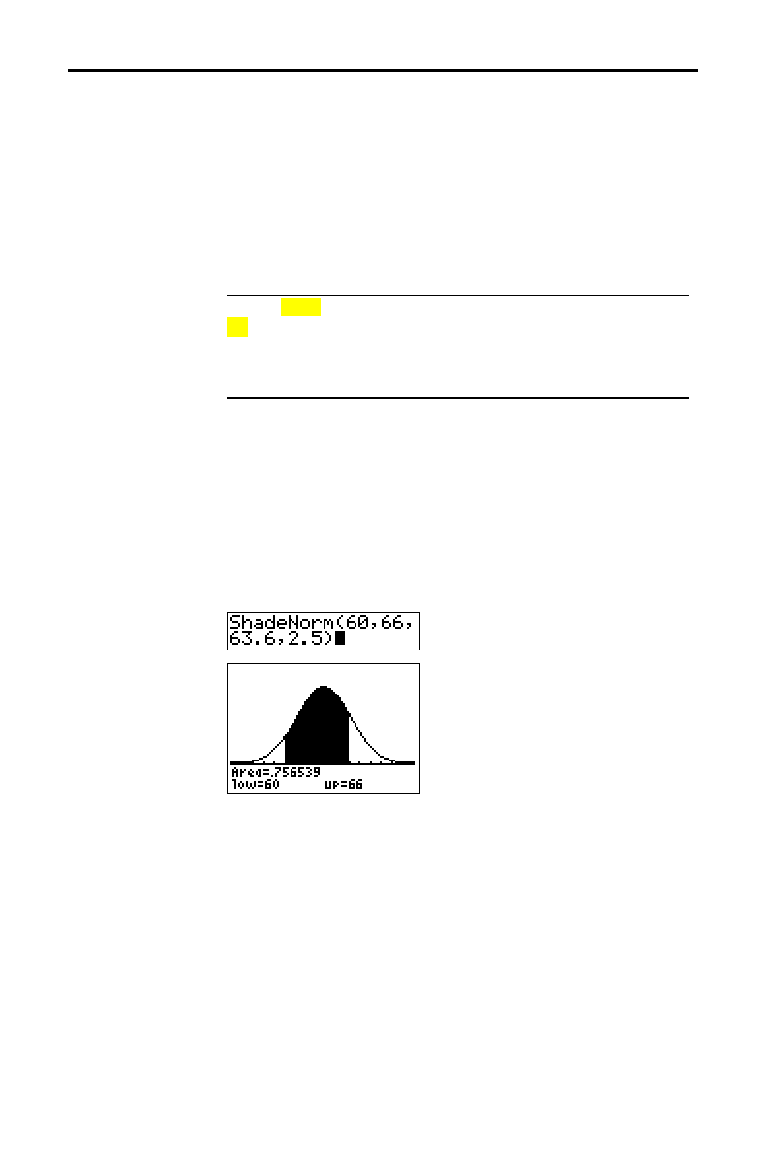
ShadeNorm( draws the normal density function specified
by mean
m
and standard deviation
s
and shades the area
between
lowerbound
and
upperbound
. The defaults are
m
=0 and
s
=1.
ShadeNorm(
lowerbound
,
upperbound
[
,
m
,
s
]
)
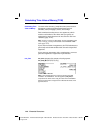
Note:
For this example,
Xmin = 55
Xmax = 72
Ymin =
L
.05
Ymax = .2
Distribution Shading
DISTR DRAW
Menu
ShadeNorm(