


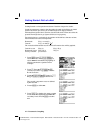

5-2 Polar Graphing
8305POLR.DOC TI-83 international English Bob Fedorisko Revised: 02/19/01 12:19 PM Printed: 02/19/01 1:36
PM Page 2 of 6
Getting Started is a fast-paced introduction. Read the chapter for details.
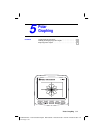
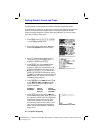
The polar equation R=Asin(B
q
) graphs a rose. Graph the rose for A=8 and
B=2.5, and then explore the appearance of the rose for other values of A and B.
1. Press
z
to display the mode screen.
Press
†
†
†
~
~
Í
to select
Pol
graphing mode. Select the defaults (the
options on the left) for the other mode
settings.
2. Press
o
to display the polar
Y=
editor.
Press
8
˜
2.5
„
¤
Í
to define
r
1
.
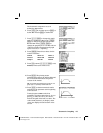
3. Press
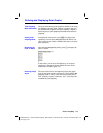
q
6 to select 6:ZStandard and
graph the equation in the standard viewing
window. The graph shows only five petals
of the rose, and the rose does not appear
to be symmetrical. This is because the
standard window sets
q
max=2
p
and defines
the window, rather than the pixels, as
square.
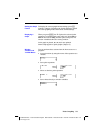
4. Press
p
to display the window
variables. Press
†
4
y
[
p
] to increase the
value of
q
max
to 4
p
.
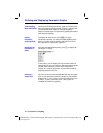
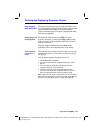
5. Press
q
5 to select 5:ZSquare and plot
the graph.
6. Repeat steps 2 through 5 with new values
for the variables
A and B in the polar
equation
r
1
=Asin(B
q
). Observe how the new
values affect the graph.
Getting Started: Polar Rose