


13-2 Inferential Statistics and Distributions
8313INFE.DOC TI-83 international English Bob Fedorisko Revised: 02/19/01 12:47 PM Printed: 02/19/01 1:38 PM
Page 2 of 36
Getting Started is a fast-paced introduction. Read the chapter for details.
Suppose you want to estimate the mean height of a population of women given
the random sample below. Because heights among a biological population tend
to be normally distributed, a
t
distribution confidence interval can be used
when estimating the mean. The 10 height values below are the first 10 of 90
values, randomly generated from a normally distributed population with an
assumed mean of 165.1 cm. and a standard deviation of 6.35 cm.
(
randNorm(165.1,6.35,90) with a seed of 789).
Height (in cm.) of Each of 10 Women
169.43 168.33 159.55 169.97 159.79 181.42 171.17 162.04 167.15 159.53
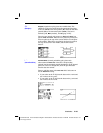
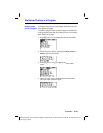
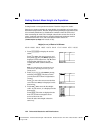
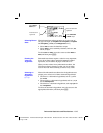
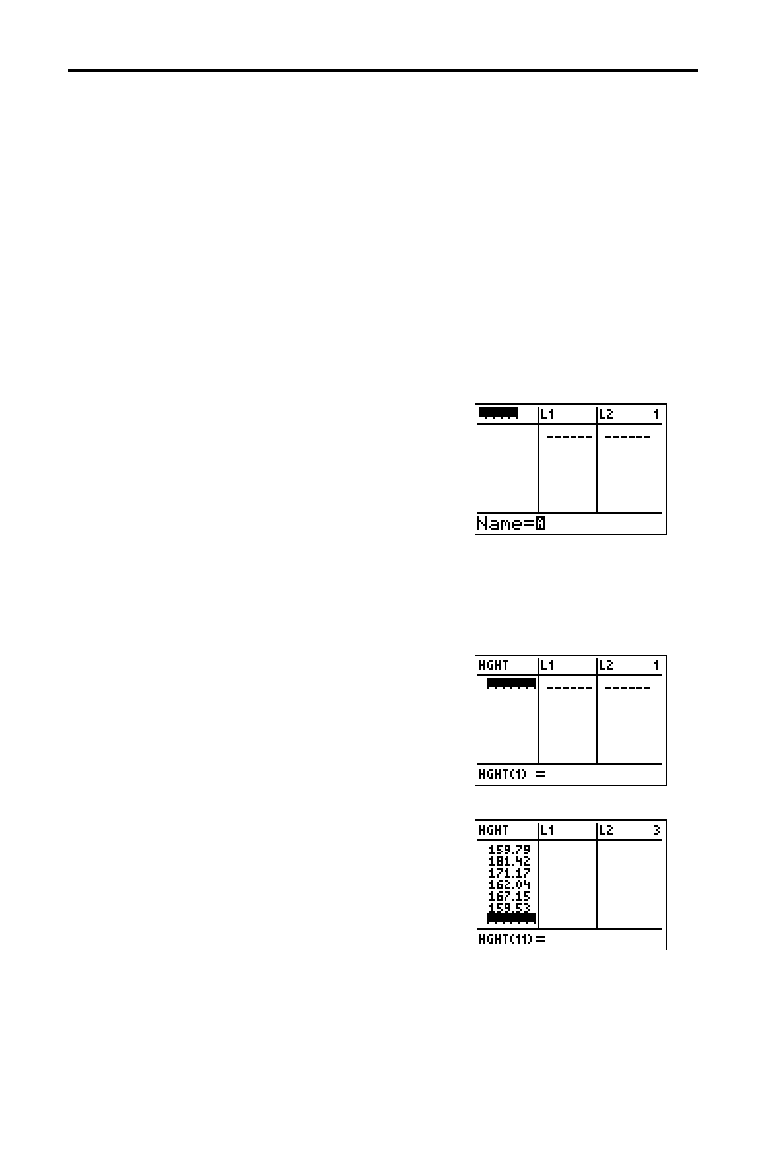
1. Press
…
Í
to display the stat list
editor.
Press
}
to move the cursor onto
L
1
, and
then press
y
[
INS
]. The Name= prompt is
displayed on the bottom line. The
Ø
cursor
indicates that alpha-lock is on. The
existing list name columns shift to the
right.
Note:
Your stat editor may not look like the one
pictured here, depending on the lists you have
already stored.
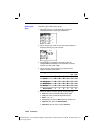
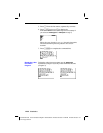
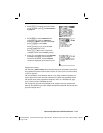
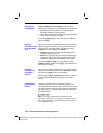
2. Enter [
H
] [
G
] [
H
] [
T
] at the Name= prompt,
and then press
Í
. The list to which
you will store the women’s height data is
created.
Press
†
to move the cursor onto the first
row of the list.
HGHT(1)=
is displayed on the
bottom line.
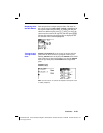
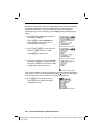
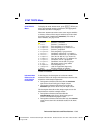
3. Press 169
Ë
43 to enter the first height
value. As you enter it, it is displayed on the
bottom line.
Press
Í
. The value is displayed in the
first row, and the rectangular cursor
moves to the next row.
Enter the other nine height values the
same way.
Getting Started: Mean Height of a Population