


Statistics 12-29
8312STAT.DOC TI-83 international English Bob Fedorisko Revised: 02/19/01 12:42 PM Printed: 02/19/01 1:37
PM Page 29 of 38
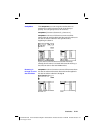
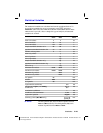
The statistical variables are calculated and stored as indicated below. To
access these variables for use in expressions, press
, and select
5:Statistics. Then select the
VARS
menu shown in the column below under
VARS
menu. If you edit a list or change the type of analysis, all statistical
variables are cleared.
Variables
1
.
Var
Stats
2
.
Var
Stats
Other
VARS
menu
mean of x values
vv
XY
sum of x values
G
x
G
x
G
sum of x
2
values
G
x
2
G
x
2
G
sample standard deviation of xSxSx
XY
population standard deviation of x
s
x
s
x
XY
number of data points nn
XY
mean of y values
w
XY
sum of y values
G
y
G
sum of y
2
values
G
y
2
G
sample standard deviation of ySy
XY
population standard deviation of y
s
y
XY
sum of x
…
y
G
xy
G
minimum of x values minX minX
XY
maximum of x values maxX maxX
XY
minimum of y values minY
XY
maximum of y values maxY
XY
1st quartile Q
1
PTS
median Med
PTS
3rd quartile Q
3
PTS
regression/fit coefficients a, b
EQ
polynomial, Logistic, and SinReg
coefficients
a, b, c,
d, e
EQ
correlation coefficient r
EQ
coefficient of determination r
2
, R
2
EQ
regression equation RegEQ
EQ
summary points (Med
.
Med only) x1, y1, x2,
y2, x3, y3
PTS
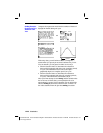
The first quartile (Q
1
) is the median of points between
minX and Med (median). The third quartile (Q
3
) is the
median of points between
Med and maxX.
Statistical Variables
Q
1
and Q
3