


Getting Started 13
8300GETM.DOC TI-83 international English Bob Fedorisko Revised: 02/19/01 11:06 AM Printed: 02/19/01 11:06
AM Page 13 of 18
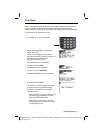
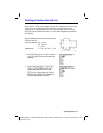
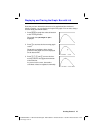
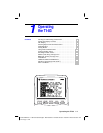
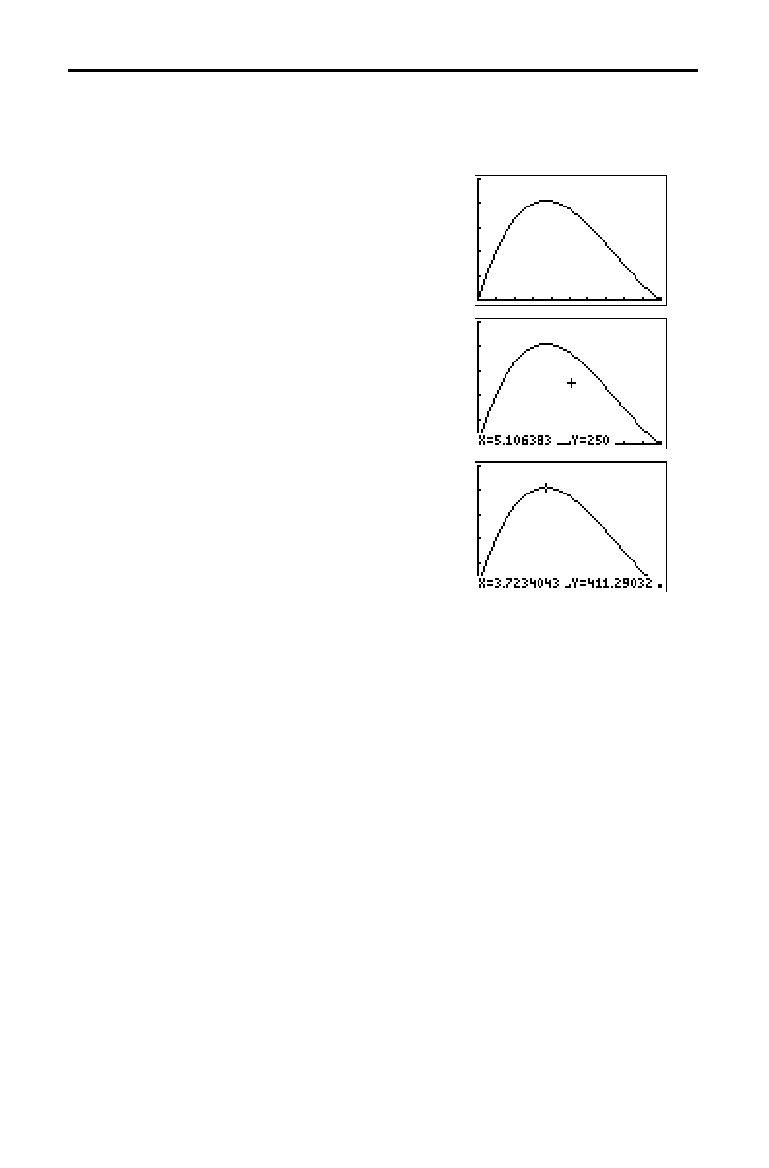
Now that you have defined the function to be graphed and the window in
which to graph it, you can display and explore the graph. You can trace along a
function using the
TRACE
feature.
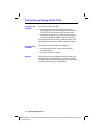
1. Press
s
to graph the selected function
in the viewing window.
The graph of
Y
1
=(20
N
2X)(25
à
2
N
X)X is
displayed.
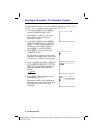
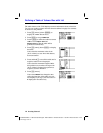
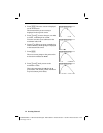
2. Press
~
to activate the free-moving graph
cursor.
The
X and Y coordinate values for the
position of the graph cursor are displayed
on the bottom line.
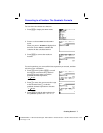
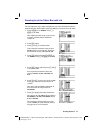
3. Press
|
,
~
,
}
, and
†
to move the free-
moving cursor to the apparent maximum
of the function.
As you move the cursor, the
X and Y
coordinate values are updated continually.
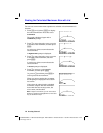
Displaying and Tracing the Graph: Box with Lid