


3-22 Function Graphing
8303FUNC.DOC TI-83 international English Bob Fedorisko Revised: 02/19/01 12:16 PM Printed: 02/19/01 1:35
PM Page 22 of 28
8303FUNC.DOC TI-83 international English Bob Fedorisko Revised: 02/19/01 12:16 PM Printed: 02/19/01 1:35
PM Page 22 of 28
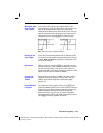
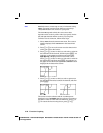
ZStandard replots the functions immediately. It updates the
window variables to the standard values shown below.
Xmin=
L
10 Ymin=
L
10 Xres=1
Xmax=10 Ymax=10
Xscl=1 Yscl=1
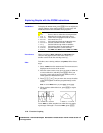
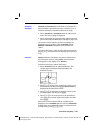
ZTrig
replots the functions immediately. It updates the
window variables to preset values that are appropriate for
plotting trig functions. Those preset values in
Radian mode
are shown below.
Xmin=
L
(47
à
24)
p
Ymin=
L
4
Xmax=(47
à
24)
p
Ymax=4
Xscl=
p
/2 Yscl=1
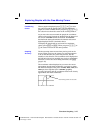
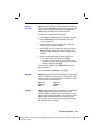
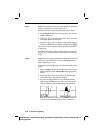
ZInteger
redefines the viewing window to the dimensions
shown below. To use
ZInteger, move the cursor to the point
that you want to be the center of the new window, and
then press
Í
;
ZInteger replots the functions.
@
X=1 Xscl=10
@
Y=1 Yscl=10
ZoomStat
redefines the viewing window so that all
statistical data points are displayed. For regular and
modified box plots, only
Xmin and Xmax are adjusted.
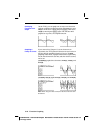
ZoomFit replots the functions immediately. ZoomFit
recalculates YMin and YMax to include the minimum and
maximum
Y values of the selected functions between the
current
XMin and XMax. XMin and XMax are not changed.
ZStandard
ZTrig
ZInteger
ZoomStat
ZoomFit