


Sequence Graphing 6-7
8306SEQN.DOC TI-83 international English Bob Fedorisko Revised: 02/19/01 12:22 PM Printed: 02/19/01 1:36
PM Page 7 of 16
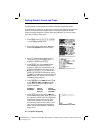
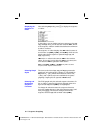
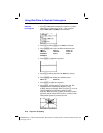
To display the window variables, press
p
. These
variables define the viewing window. The values below are
defaults for
Seq graphing in both Radian and Degree angle
modes.
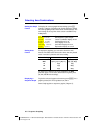
nMin=1
Smallest
n
value to evaluate
nMax
=
10
Largest
n
value to evaluate
PlotStart
=
1
First term number to be plotted
PlotStep
=
1
Incremental
n
value (for graphing only)
Xmin
=
L
10
Smallest X value to be displayed
Xmax
=
10
Largest X value to be displayed
Xscl
=
1
Spacing between the X tick marks
Ymin
=
L
10
Smallest Y value to be displayed
Ymax
=
10
Largest Y value to be displayed
Yscl
=
1
Spacing between the Y tick marks
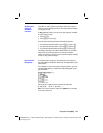
n
Min must be an integer
‚
0.
n
Max, PlotStart, and PlotStep
must be integers
‚
1.
n
Min is the smallest
n
value to evaluate.
n
Min also is
displayed in the sequence
Y=
editor.
n
Max is the largest
n
value to evaluate. Sequences are evaluated at u(
n
Min),
u(
n
Min+1), u(
n
Min+2) , . . . , u(
n
Max).
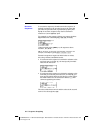
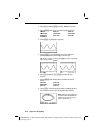
PlotStart is the first term to be plotted. PlotStart=1 begins
plotting on the first term in the sequence. If you want
plotting to begin with the fifth term in a sequence, for
example, set
PlotStart=5. The first four terms are evaluated
but are not plotted on the graph.
PlotStep is the incremental
n
value for graphing only.
PlotStep does not affect sequence evaluation; it only
designates which points are plotted on the graph. If you
specify
PlotStep=2, the sequence is evaluated at each
consecutive integer, but it is plotted on the graph only at
every other integer.
Setting Window
Variables